Category

Inflation Watch

Headline and Core Inflation in June-2014

By Inflation Watch

The Consumer Price Index rose a seasonally adjusted 0.3% in June. Excluding the often-volatile categories of food and energy, prices rose 0.1% from May.

The year-over-year increase in all prices was 2.1% in June, and prices excluding food and energy slipped to a 1.9% annual gain in June from 2% in May.

A broad rise in prices during May took the annual inflation rate to 2.1%, its highest level since October 2012. But a 3.3% monthly spike in gasoline prices accounted for most of the June increase as motor-vehicle prices fell, prices for medical services were flat and shelter costs rose 0.2%.

Food prices ticked up just 0.1% in June from the prior month after rising 0.5% in May and 0.4% in each of the prior three months. Drought and livestock and crop disease have caused prices for beef, pork, citrus fruits and other groceries to spike this year, driving the annual increase in food prices from 1.1% in January to 2.5% in May. The annual rise in food prices slipped to 2.3% in June.

(Source: BLS and WSJ)

Fed’s Favorite Inflation Gauge-PCE Price Index: Headline and Core Remain Below Target, But Rising

By Inflation Watch

The latest Headline PCE price index year-over-year (YoY) rate of 1.62% is a relatively large increase the previous month’s 1.14% (a slight adjustment from 1.15%). The Core PCE index of 1.42% is up from 1.21% the previous month.

The general disinflationary trend in core PCE (the blue line in the charts below) must be quite troubling to the Fed. After years of ZIRP and waves of QE, this closely watched indicator consistently moved in the wrong direction. Since April of last year has hovered in a narrow YoY range of 1.21% to 1.10%, although the April data point has broken above the range. Is this the beginning of a major trend reversal? This will be a closely watched series by the ongoing inflation/deflation debate.

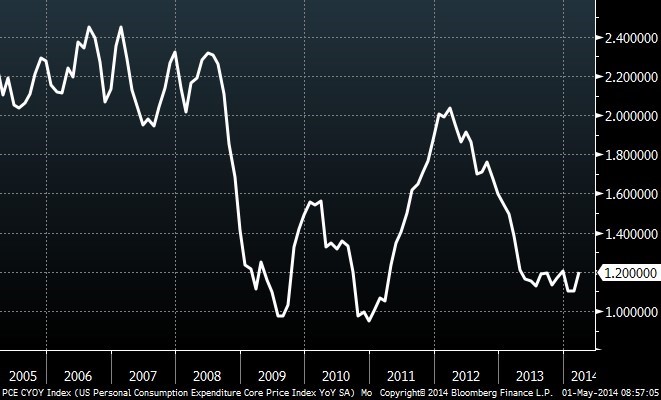
The adjacent thumbnail gives us a close-up of the trend in YoY Core PCE since January 2012. I’ve highlighted the narrow 12-month range that appears to have been breached to the upside in April.

The first chart below shows the monthly year-over-year change in the personal consumption expenditures (PCE) price index since 2000. I’ve also included an overlay of the Core PCE (less Food and Energy) price index, which is Fed’s preferred indicator for gauging inflation. I’ve highlighted 2 to 2.5 percent range. Two percent had generally been understood to be the Fed’s target for core inflation. However, the December 2012 FOMC meeting raised the inflation ceiling to 2.5% for the next year or two while their accommodative measures (low FFR and quantitative easing) are in place.

Click to View
Click for a larger image

I’ve calculated the index data to two decimal points to highlight the change more accurately. It may seem trivial to focus such detail on numbers that will be revised again next month (the three previous months are subject to revision and the annual revision reaches back three years). But core PCE is such a key measure of inflation for the Federal Reserve that precision seems warranted.

For a long-term perspective, here are the same two metrics spanning five decades.

Click to View
Click for a larger image

(Source: Advisor Perspectives)


India Wholesale Inflation Eases in April

By Inflation Watch

India’s wholesale inflation eased slightly in April helped by a decline in fuel prices.

The wholesale price index rose 5.20% from a year earlier, slower than the 5.70% increase in March, commerce ministry data released Thursday showed. That was better than the median 5.80% rise predicted in a poll of 12 economists by The Wall Street Journal.

Economists are now watching for the onset of the June to September monsoon season to track the rainfall the country receives this year. India’s weather department has forecast below-normal rainfall, a prospect that could hurt farm output and push up food prices in coming months.

While wholesale inflation has eased, consumer inflation in April wasn’t as encouraging.

Government data released Monday showed inflation at the retail level accelerated to 8.59% on-year from 8.31% in March.

Economists say the central bank will be under pressure to keep interest rates elevated as inflation is still moderately higher than the 8% level it wants to bring it down to by January 2015.

U.S. Producer prices see largest increase in April in over a year

By Inflation Watch

We are keeping a close eye on indicators that might point to a rise in inflationary pressures. Is the outperformance of Real Assets YTD indicating this?

U.S. producer prices saw their largest increase in over a year last month, hinting at some inflation pressures at the wholesale level.

The Labor Department said its seasonally adjusted producer price index (PPI) for final demand advanced 0.6% in April, marking the biggest rise since September 2012. It was the second consecutive month that metric advanced. In March, the index increased 0.5%.

The Department of Labor’s PPI measures a change in selling prices received by domestic producers. The price index for foods reported the largest increase last month, while energy and transportation and warehousing prices also rose.


India Inflation Watch

By Inflation Watch

Consumer Inflation rose in April to 8.59%. The elevated inflation levels could pressure on the central bank to keep interest rates at current levels despite pressure from Indian industry to bring them down.

The RBI wants to see consumer inflation ease to 8% by January 2015 and 6% in the following year.

The country’s wholesale price index likely rose 5.80% in April from a year earlier, according to a poll of 12 economists by The Wall Street Journal. The index increased 5.70% in March, which was its fastest rise in three months. The government is scheduled to announce the rate on Thursday.

Food prices rose during the month as vegetable and fruit supplies from a bumper crop earlier in the year dried up. Lower fuel prices helped offset some of the higher food prices, economists said. Indian fuel retailers lowered gasoline prices twice in April.

For the rest of this year economists and weather watchers are worried that below-normal rains during the June through September monsoon season could trigger inflation again.

(Source: Wall Street Journal)

China’s Inflation Slows More Than Estimated

By Inflation Watch

Consumer inflation in China moderated to an 18-month low and the decline in factory-gate prices persisted, giving the government more scope to loosen policies if a growth slowdown deepens.

The consumer price index rose 1.8 percent from a year earlier in April, the National Bureau of Statistics said today in Beijing. That compares with the median estimate of 2.1 percent in a Bloomberg News survey and a 2.4 percent gain in March. The producer-price index fell 2 percent, the 26th straight decline, after a 2.3 percent drop the previous month.

Today’s data add to signs that domestic demand remains muted, with falling commodity prices exacerbating overcapacity in industries including steel and cement. The lack of inflationary pressure will allow the People’s Bank of China to relax monetary policy to support the economy if Premier Li Keqiang’s full-year goal of about 7.5 percent is threatened.

(Source: Bloomberg)

US Dollar Index-DXY

By Inflation Watch

US Dollar Index

Is the US dollar headed for a fall despite positive economic data recently?

Stronger than expected non-farm payrolls and a surging composite PMI data were not enough to send real interest rates higher. Treasury yields have fallen due to Ukrainian tensions and weaker than expected PMI data from China. The net effect of these developments has been a weaker US dollar, which looks to be in danger of falling to its lowest levels in two years on a trade-weighted basis.

US Core Personal Consumption Expenditure Index Year over Year

By Inflation Watch

US PCE Core Year over Year


Yesterday we noted stagnant price growth in Europe, but the environment in the US is hardly inflationary. The Federal Reserve’s favorite inflation metric, the core Personal Consumption Expenditure index (PCE), grew 1.2% Y/Y in March, in-line with expectations and slightly higher than February. Janet Yellen and company really need this index to turn higher as they continue to withdraw stimulus from the economy. The FOMC sounded optimistic about growth after yesterday’s meeting, where it cut monthly asset purchases to $45bn. If PCE indicators were to fall from current levels, it would be interesting to see whether the Fed would reverse course by increasing asset purchases or opt for a new strategy.

(Source: GBI)

Yellen Concerned Fed Model Fails to Predict Price Moves

By Inflation Watch

Federal Reserve Chair Janet Yellen is concerned that the standard models central banks use to forecast inflation may be broken.

Behind her disquiet: the failure of the models to foresee the path of prices in the U.S. during the last recession and its aftermath and in Japan during its deflationary period from 1998 to 2012. U.S. inflation has been higher than the simulations suggested, while Japanese price declines proved more persistent.

Yellen alluded to her concerns in a speech last week, saying the Fed has to “watch carefully” to see if inflation picks up as the central bank projects — and hopes — during the next few years.

Standard computer models rest on two main pillars in trying to forecast longer-run price pressures: the amount of slack in the economy, usually measured by unemployment, and inflation expectations.

The higher the joblessness rate is above its so-called natural rate, the harder it is for employees to win pay increases and for inflation to accelerate. Yellen pegs that natural rate — at which price increases neither speed up nor slow down — at 5.2 percent to 5.6 percent. Unemployment in March was 6.7 percent.

Most Fed policy makers see inflation climbing to 1.5 percent to 2 percent by the end of next year and 1.7 percent to 2 percent at the end of 2016, according to projections released on March 19.

(Source: Bloomberg)

Pump Prices Help to Drive Inflation Outlook

By Inflation Watch

Pump Prices Help To Drive Inflation Outlook


While we watch many indicators that might point to a future rise in inflation, the above chart depicts how consumers correlate near term inflation expectations with prices paid at the pump.

According to Friday’s consumer sentiment survey put out by Thomson-Reuters and the University of Michigan, consumers think inflation will be 3.2% a year from now, little changed from expectation readings so far this year. (Consumers almost always think inflation is running higher than the government’s official measures. The consumer price index, for instance, shows prices are up just 1.5% in the past year.)

Changes in gasoline prices tend to color how consumers view inflation. That’s not a surprise since gas prices are very visible and drivers tend to fill up frequently. Prices at the pump have been rising lately. Add in the price jump for some grocery items—most notably beef and pork—and it would not be surprising if inflation expectations edge up in coming months.

(Source: Wall Street Journal)