All Posts By

EWM Team

The United States of Unicorns

By Unicorn Technology, Venture Capital

Collectively, US unicorns are worth approximately $360B. Combined, these companies have raised just over $73B. To see the full list of US unicorns and associated data, check out the CB Insights blog.

The United States is home to 105 unicorn companies valued at $1B+. As of 7/25/2017, six private US companies are worth over $10B. The two most valuable unicorns in the US are Uber ($68B) and Airbnb ($29.3B). Palantir Technologies and WeWork, both valued at $20B, are tied for third.

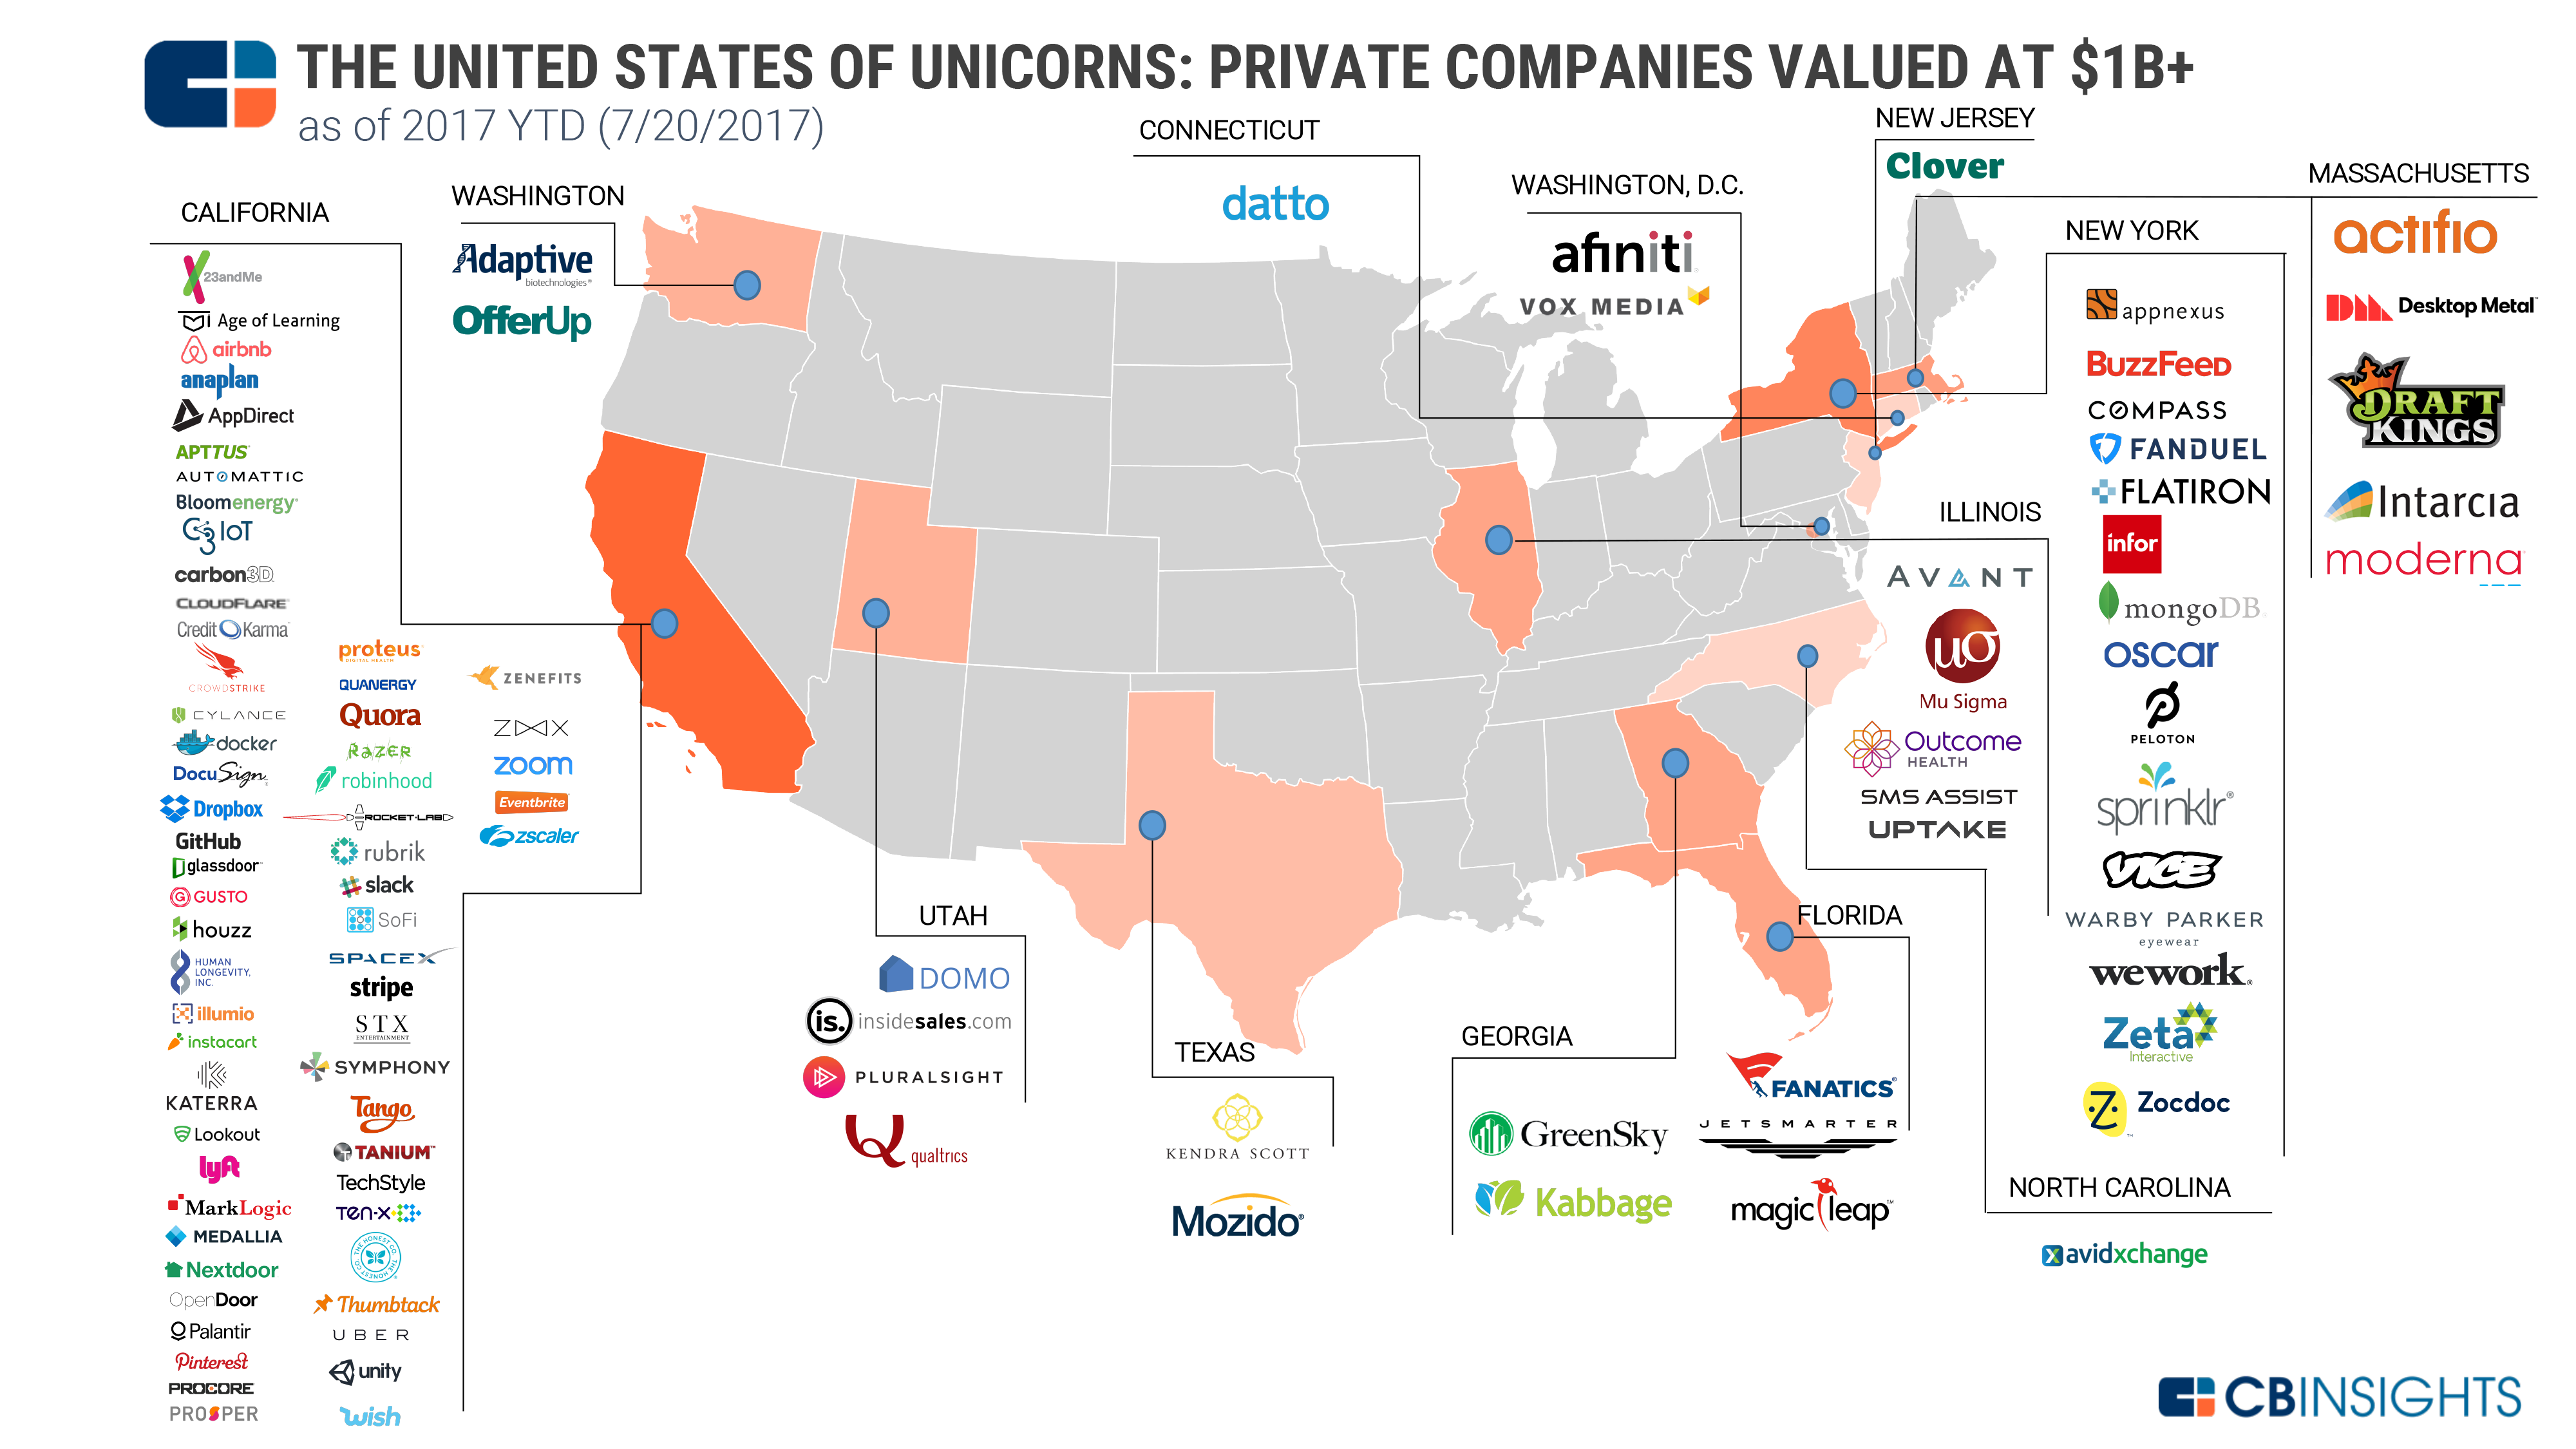
Of the top four highest valued, only WeWork (which is based in NYC) is headquartered outside California. California has the highest unicorn “population” of any US state by far, with 62 billion-dollar startups inside its borders. New York ranks second with 15, followed by Massachusetts and Illinois with five each. Eight other states and the District of Columbia are also home to at least one company worth $1B+.

Using the CB Insights database and our real-time global unicorn tracker, we visualized the locations of every US-based unicorn in the map below.

The-United-States-Of-Unicorns-7.26.17-1
KEY INSIGHTS ABOUT THE COMPANIES IN THIS MAP:

  • Collectively, US unicorns are worth approximately $360B.
  • Combined, these companies have raised just over $73B.
  • After California, New York, Massachusetts, and Illinois, the next-highest unicorn populations are found in Utah (with four) and Florida (with three).
  • The top five most well-funded US unicorns are: Uber ($15.1B raised), Airbnb ($4.4B), WeWork ($2.76), Infor ($2.63B), and Lyft ($2.46B).
  • The oldest unicorn in the US is the greentech company Bloom Energy, which reached a valuation above $1B in 2009.
  • The newest unicorn in the US is 3D printing startup Desktop Metal, which became a unicorn in July 2017 after raising a $115M Series D.
  • The three most active investors in US-based unicorns, by total number of deals to these companies, are the VC firms Sequoia Capital, Andreessen Horowitz, and Tiger Global Management.

Learn about our Unicorn Technology Fund by registering here: https://endowmentwm.com/accredited-investor-signup/

Source: CBInsights

ewm-e-logo-tm

The Other 496 S&P Stocks

By News

In an article from the Wall Street Journal, Justin Lahart describes how the immense growth of Amazon, Apple, Google parent Alphabet, and Facebook has been propelling a substantial portion of the S&P 500’s gains.

The article also touches on how the S&P 500 Growth index has outperformed, while the S&P 500 Value index has under-performed. It goes on to discuss the S&P 500 Equal Weight Index and its inability to outperform the S&P 500, indicating that midsize and small company shares, within the growth and value categories, have been under-performing.

Given the fact that the stock market is currently driven by a small amount of stocks, it could be setting itself up for trouble. According to Lahart, “it might not take much for investors to suddenly pine for all the stocks and styles they have abandoned“.

Link to full article

ewm-e-logo-tm

3-D Endowment Investment Philosophy®

By Endowment Index™

By Robert L. Riedl, CPA, CFP®, AWMA®

Endowment Wealth Management (“EWM”) is named after our trademarked Endowment Investment Philosophy®, and applies our investment approach, which was pioneered by university endowments seeking to improve their risk-adjusted returns. EWM is a fee-based, Registered Investment Advisor (RIA) that serves as a fiduciary adviser, putting the best interests of our clients first.
We differentiate our firm’s wealth management services from other advisers by combining our unique 3-D Endowment Investment Philosophy® with three layers of unique investment options. Our firm provides our clients access to a combination of low cost passive ETF’s, specialty active satellite managers and illiquid accredited & qualified private equity and debt investment options.
Our goal is to enhance the traditional two-dimensional 60/40 stock-bond portfolio to a three-dimensional allocation by adding a third bucket. This bucket, which it calls “risk-managed” is comprised of real assets, private equity and hedge strategies. That third risk managed allocation grew out of how Yale and Harvard have institutionally managed their university endowments for the past 20 to 30 years.
Our firm’s Endowment Investment Philosophy® is also encapsulated in our Firm’s proprietary Endowment Index® calculated by NASDAQ OMX® (symbol “ENDOW”), a rules-based benchmark based on the asset allocations of over 800 college and university endowments. The Index has garnered national attention from ETF.com, WealthManagement.com and others.

As professionals specializing in family wealth management, we appreciate that our clients trust our professional judgment not just to manage their investments, but to also help sustain the economic future of their most valuable-asset –their family. The word ‘family’ in ‘family wealth’ always comes before wealth. Having a family wealth plan is critical to the whole financial planning process and achieving sustainable multi-generational family wealth, unity and legacy. Only when a family has a comprehensive knowledge of their financial holdings, the worth of those holdings, and the related correlations between all of the holdings, can they effectively implement an investment process leading to sustainable long-term family wealth.

ewm-e-logo-tm

U.S. Private Equity Breakdown-2Q-2017

By Alternative Investments

In the 2Q US PE Breakdown report by Pitchbook & Merrill, it examines each phase of the industry’s cycle and investigates the factors most relevant to investors.

Key takeaways in the report:

  • PE fundraising through June 2017 has mirrored that of the 2007 boom. Capital commitments are on pace to surpass $220 billion.
  • After clocking in at 10.7x in 2016, US M&A EBITDA multiples have regressed slightly in the first half of the year, to 10.5x. Meanwhile, the median debt percentage has increased to 56.3% as high-yield bond spreads reached a three-year low.
  • Deal flow held steady in 2Q 2017, though it is still slightly below last year’s pace. Across the US, 886 deals were completed, totaling $153.6 billion in value.
  • PE exits continued their slowdown with $102.3 billion in exit value over 474 deals. The industry’s selling rate appears to be entering a new normal following the sale of excess company inventory from the last recession.

Download the full report here: PitchBook_2Q_2017_US_PE_Breakdown

What percentage of Startups Fail?

By Venture Capital

I have been anecdotally using the statistic that: “Nine out of 10 startups fail.” The problem? It’s not true.

Cambridge Associates, a global investment firm based in Boston, tracked the performance of venture investments in 27,259 startups between 1990 and 2010. Its research reveals that the real percentage of venture-backed startups that fail—as defined by companies that provide a 1X return or less to investors—has not risen above 60% since 2001. Even amid the dotcom bust of 2000, the failure rate topped out at 79%.

Read the full article here: http://fortune.com/2017/06/27/startup-advice-data-failure/

ewm-e-logo-tm


If You Think Stocks Are Dull, Look at the Economy

By Financial Markets & Economy

According to Justin Lahart of the Wall Street Journal, volatility has seemingly vanished from the stock market, and the simple reason is that economy itself is so calm.

Economic volatility within the U.S. and across the globe is incredibly low, and with this low volatility comes the risk that investors may become far too complacent.

Over the past three years, the standard deviation of the annualized change in U.S. GDP has only been 1.5 percentage points, which is historically about as low has it has ever been. Amazingly enough, global GDP is displaying the same trend.

According to J.P. Morgan economist Joseph Lupton, this lack of volatility not only stems from less shakiness within individual economies, but also because they have become less correlated with one another.

From an investment standpoint, low economic volatility is a good thing, because investors get hit with fewer surprises, however, it can also lure them into complacency and leave them much more vulnerable if volatility were to increase in the future.

Link to article

ewm-e-logo-tm

Internet Trends Report 2017

By Alternative Investments, Venture Capital

Here’s a first look at the most highly anticipated slide deck in Silicon Valley. This year’s report includes 355 slides and tons of information, including a new section on healthcare that Meeker didn’t present live.

Here are some takeaways:

  • Global smartphone growth is slowing: Smartphone shipments grew 3 percent year over year last year, versus 10 percent the year before. This is in addition to continued slowing internet growth, which Meeker discussed last year.
  • Voice is beginning to replace typing in online queries. Twenty percent of mobile queries were made via voice in 2016, while accuracy is now about 95 percent.
  • In 10 years, Netflix went from 0 to more than 30 percent of home entertainment revenue in the U.S. This is happening while TV viewership continues to decline.
  • Entrepreneurs are often fans of gaming, Meeker said, quoting Elon Musk, Reid Hoffman and Mark Zuckerberg. Global interactive gaming is becoming mainstream, with 2.6 billion gamers in 2017 versus 100 million in 1995. Global gaming revenue is estimated to be around $100 billion in 2016, and China is now the top market for interactive gaming.
  • China remains a fascinating market, with huge growth in mobile services and payments and services like on-demand bike sharing.
  • While internet growth is slowing globally, that’s not the case in India, the fastest growing large economy. The number of internet users in India grew more than 28 percent in 2016. That’s only 27 percent online penetration, which means there’s lots of room for internet usership to grow. Mobile internet usage is growing as the cost of bandwidth declines.
  • In the U.S. in 2016, 60 percent of the most highly valued tech companies were founded by first- or second-generation Americans and are responsible for 1.5 million employees. Those companies include tech titans Apple, Alphabet, Amazon and Facebook.
  • Healthcare: Wearables are gaining adoption with about 25 percent of Americans owning one, up 12 percent from 2016. Leading tech brands are well-positioned in the digital health market, with 60 percent of consumers willing to share their health data with the likes of Google in 2016.

Download the Internet Trends Report here: Internet+Trends+2017+Report

Source: KPCB, Recode

The 9 most active investors in Bay Area startups

By Venture Capital

It’s true that more and more startups based outside the Bay Area are receiving significant VC funding—last year was the first time in a decade Silicon Valley investors made more non-local than local deals. But the San Francisco region still receives far more capital than any other area.

Since the beginning of last year, 1,697 investors have participated in at least one round involving a Bay Area-based company, per PitchBook data, putting $38.3 billion in capital to work across 1,813 completed deals. The majority (54.6%) of those transactions have been in the software sector, followed in frequency by commercial services (6.5%) and healthcare devices & supplies (5.2%). In terms of round size, a plurality of investments (31.7%) have ranged between $1 million and $5 million, with the $10 million to $25 million bucket ranking second (24.8%).

Here are the top 9 investors in Bay Area-based companies since the beginning of 2016, along with their investment counts (excluding accelerator rounds):

1. NEA (66)
2. Khosla Ventures (55)
3. GV (49)
4. Andreessen Horowitz (47)
5. Y Combinator (43)
6. Kleiner Perkins Caufield & Byers (40)
7. Sequoia (40)
8. SV Angel (37)
9. First Round Capital (37)

Source: Pitchbook

2016 Private Equity By The Numbers

By Alternative Investments


This morning PitchBook released its report on 2016 private equity activity. It’s not great. Deal volume is down. Deal multiples are up. Equity contributions are up. Exit values are down. Fundraising is down. PitchBook calls this a “return to normalcy” from the record-breaking highs of 2014 and the “turning point” of 2015. The breakdown:
• Deals: Private equity firms invested $649 billion into 3,538 deals last year. That’s down 12% by value and 14% by volume from the year prior.
• Multiples: Median enterprise value hit 10.9x EBITDA for M&A transactions last year, up from 10x in 2015 and 8x in 2010. Why? Too few feasible investment opportunities, PitchBook posits.
• Debt-to-equity: The median debt percentage for private equity and M&A deals fell to 50.5% of the enterprise value, compared to 56.8% in 2015. Buyout shops are having to contribute more equity to deals.
• Exits: Buyout firms pulled $316 billion on 1,097 exits in 2016. That’s down 22% by value and 18% by volume from 2015.
• Fundraising: 11% fewer private equity funds raised money last year than the year prior, and commitments were down 12%.

Source: Pitchbook