$194.86 billion
U.S. exports rose to their highest level on record in November, a seasonally adjusted $194.86 billion, the Commerce Department said Tuesday.
(Source: Wall Street Journal)
U.S. exports rose to their highest level on record in November, a seasonally adjusted $194.86 billion, the Commerce Department said Tuesday.
(Source: Wall Street Journal)
$16.6 billion
That is how much the Swiss National Bank said its gold holdings fell in value last year.
(Source: Wall Street Journal)
19
For the first time in at least 19 years, the New York Stock Exchange in 2013 landed more initial public offerings of technology and Internet companies than the Nasdaq Stock Market.
(Source: Wall Street Journal)
FireEye said Thursday it is paying nearly $1 billion to buy closely held Mandiant, a computer security firm known for outing Chinese hackers.
(Source: Wall Street Journal)
Fiat agreed to get full control of Chrysler in a $4.35 billion deal, ending a standoff that had clouded the future of both companies.
(Source: Wall Street Journal)
The Dow Jones Industrial Average added 72.37 points, or 0.4%, to 16576.66, closing at a record high for the 52nd time this year.
The S&P 500 rose 7.29 points, or 0.4%, to 1848.36. The Nasdaq Composite Index gained 22.39 points, or 0.5%, to 4176.59. Stock trading will be closed Wednesday for New Year’s Day.
In a year fraught with apparent headwinds, including the prospects of reduced Federal Reserve stimulus and a federal government shutdown, the Dow climbed 27% for its best annual performance since 1995. Bulls point to continued earnings and profit growth—albeit at a slow pace. Some say attractive investments outside of equities were scarce. Bond yields remain low by historical standards and returns could suffer if interest rates rise, weighing on bond prices.
Moreover, investors shrugged off the start of the Fed’s plan announced this month to “taper,” or scale back, its stimulus program. Stocks rose for a fourth-straight month in December, rebounding from a bout of weakness before the central bank’s policy meeting in the middle of the month.
The Dow’s annual gain was its fifth-straight, the longest such stretch since a nine-year rally through 1999. The S&P 500 gained 30% in 2013, its best year since 1997.
Measures of small companies’ shares performed even better. The Russell 2000 index of small companies’ shares rallied 37% this year, its biggest such rally since 2003.
U.S. Treasury bonds ended the last trading session of 2013 on a down note as the latest government data on housing and consumers brightened the economic outlook, capping the biggest annual loss for government bonds in five years.
The benchmark 10-year note’s price was down 13/32 at the end of the shortened session at 2 p.m. EST, according to Tradeweb. The note’s yield rose to 3.03% after hitting as high as 3.036%, the highest level since July 2011.
The yield, a key reference for long-term interest rates for consumers, banks and companies in the U.S. and abroad, climbed from 1.76% at the end of 2012. That represents the biggest calendar-year increase since 2009, the last time the bond market posted a negative annual return.
When bond yields rise, their prices fall.
The precious metal retreated 28% in 2013 as many investors tried to anticipate when the U.S. Federal Reserve might cut its monthly bond purchases, which would remove a long-running support from the gold market. Many investors purchased gold as a hedge against a weaker U.S. dollar and inflation, two risks associated with the accommodative monetary policies.
Investors of all stripes slashed their gold holdings in 2013. Physical gold held by exchange-traded funds, which buy and store the metal on investors’ behalf, fell from 84.58 million troy ounces at the start of the year to 57.7 million ounces on Dec. 31, which is the lowest level of gold ETF holdings since 2009.
One exception has been gold coin buyers, who stepped up purchases from the U.S. Mint by 14% in 2013, data from the agency show. April was the Mint’s busiest month for gold coin sales, with more than 200,000 ounces of gold coins sold to dealers as gold prices posted their worst two-day decline since 1974.
Gold for February delivery, the most actively traded contract, settled down $1.50, or 0.1%, at $1,202.30 a troy ounce on the Comex division of the New York Mercantile Exchange. Gold for January delivery, the front-month contract, fell $1.20, or 0.1%, to close at $1,201.90 a troy ounce.
Natural-gas futures rose 26% this year, their biggest one-year rise since 2005 and the largest percentage gain for any commodity in 2013. After a relatively mild winter last year reduced demand for gas-powered heating in homes and offices, this winter started off unusually cold and wintry weather has persisted.
About half of all U.S. households use natural gas as their primary heating fuel, with natural-gas prices having climbed from less than $3.50/mmBtu in early November due to robust heating demand.
Unusually large amounts of natural gas have been withdrawn from storage in recent weeks, a sign of strong demand. Inventories as of Dec. 20 stood at 3.071 trillion cubic feet, 16% below the exceptionally high year-ago level and 9.2% below the five-year average for the week.
Corn futures fell on the last trading day of 2013, bringing this year’s loss to 40% and making the grain the worst performer on the S&P GSCI Index of 24 commodities.
Corn prices plunged this year as production in the U.S., the world’s biggest grower and exporter of the grain, surged to a record 13.989 billion bushels. Farmers gathered 160.4 bushels an acre from U.S. corn fields, a 30% increase from last year’s drought-ravaged crop, according to the Agriculture Department.
After the U.S. harvest was complete, market-watchers turned their attention to South America, where recent rainfall has improved crop prospects. Precipitation fell overnight in parts of Argentina and is expected to persist in the six- to 15-day period, according to Commodity Weather Group.
Chicago Board of Trade corn futures for March delivery fell 1 1/2 cents, or 0.4%, to $4.22 a bushel on Tuesday, the lowest closing price for the front-month contract since Dec. 13.
(Source: Wall Street Journal)
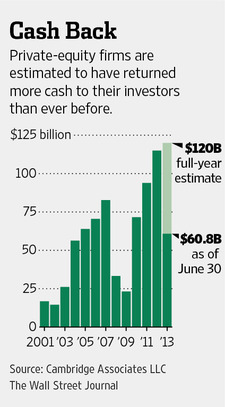
Private-equity firms are set to return a record amount of cash to their investors for 2013, after taking advantage of buoyant markets to sell hundreds of billions of dollars of investments. From initial public offerings to company debt deals that pay private-equity investors hefty dividends—this year will be remembered for the gains earned by firms that specialize in buying and selling companies, and by the pension funds, university endowments and wealthy individuals that invest in them. Investors in private-equity funds are expected to receive more than $120 billion for 2013, topping last year’s record of $115 billion, according to estimates by Cambridge Associates LLC, which gets a glimpse of firms’ finances as an adviser to private-equity investors. In the first half of 2013, private-equity firms returned $60.8 billion to investors.
For all the losses on Treasuries this year, demand for U.S. government debt remains stronger than before the financial crisis. Investors bid for $5.75 trillion of notes in government auctions in 2013, or 2.87 times the amount sold, data compiled by Bloomberg show. That’s the fourth-highest ratio since the Treasury Department began releasing the data in 1993, surpassed only in the past three years as demand peaked at 3.15 times in 2012. Before the Federal Reserve began its unprecedented stimulus in 2008, the bid-to-cover ratio never topped 2.65. While Treasuries are poised for the first drop since 2009 as the longest-term bonds suffer the world’s deepest declines, the willingness of foreign central banks, insurers and pensions to finance the largest debtor nation may temper a further jump in U.S. borrowing costs. Yields on the 10-year notes rose last week to the highest since 2011 and forecasts imply the Fed will cut its Treasury purchases by more than 50 percent from $540 billion this year after beginning to taper earlier this month…Bids for interest-bearing Treasuries outstripped the $2 trillion sold competitively this year by $3.75 trillion, data compiled by Bloomberg show. The bid-to-cover ratio was almost 20 percent greater than the average 2.44 times from 1997 to 2007.
At least 70 journalists were killed on the job around the world in 2013, according to the Committee to Protect Journalists.
(Source: Wall Street Journal)
Saudi Arabia pledged $3 billion to bolster Lebanon’s armed forces, in a challenge to the Iranian-allied Hezbollah militia’s decades long status as Lebanon’s main power broker and security force.
(Source: Wall Street Journal)