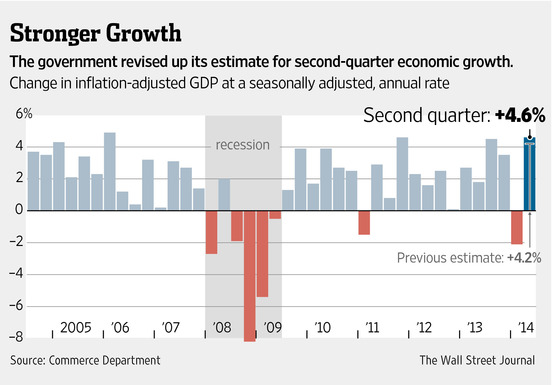
All Posts By

EWM Team

What are Business Development Companies (“BDCs”)?

By Alternative Investments

BDCs have been around since the 1980s but have recently multiplied. More than 50 of them are now listed, with a combined market capitalization in excess of $35 billion (see chart).

Growth of BDCs

BDCs are allowed to borrow as much money as they raise from shareholders, usually through fixed-rate bonds, so the total amount at their disposal is approximately $70 billion. The industry’s total valuation is only a quarter of Citigroup’s, and were they to lend out this entire sum, it would equal just 4% of America’s commercial and industrial loans. In reality, some of their money is invested in shares and some goes into property, so their impact is even smaller.

Still, BDCs are big enough to be receiving attention from businesses hungry for capital and willing to pay interest of 10% or more to get it, as well as from investors hungry for dividends, which can also exceed 10%. That is more than four times the dividend on the average stock and more than double the yield of even a junk bond.

The high payout comes with a caveat, however. Because BDCs are classified as a fund, they pay no corporate tax, unlike a bank. To preserve this status, they must distribute 90% or more of their income each year. As a result, building up their capital base is a slog. So too is finding good customers for loans, since they do not offer the prosaic products like current and payroll accounts through which banks typically acquire their customers. Many BDCs specialize in financing the acquisitions of private-equity firms. That helps to keep down costs, as they make big loans to just a few customers. But it can also suppress returns, as there is lots of competition to back private-equity deals.

Although BDCs limited borrowing makes them safer than banks, they also suffer from higher defaults. As a result, when the financial markets become volatile, and in particular when the market for high-yield debt wobbles, their shares slump and they struggle to raise capital.

Another quirk is that all but a handful of BDCs do not have internal managers; instead, they farm out their management to nationally independent firms. The managers’ compensation under such deals is often opaque but lavish. Indeed, charges akin to the “2 and 20” that hedge-fund managers once typically extracted (a management fee of 2% of assets and a performance fee of 20% of profits beyond a certain threshold) remain common.

We use BDCs within our Global Multi-Asset Income Model and Private Equity Model as an Alternative Fixed Income and Mezzanine Debt allocation, respectively.

(Source: The Economist)

Press Release: Endowment Index™ Historical Data Now Available Through Morningstar, Interactive Data and Bloomberg

By Endowment Index™, News

APPLETON, Wis., Nov. 11, 2014 /PRNewswire/

Historical index data for the Endowment Index™ — calculated by Nasdaq OMX® — is now available through major index and investment databases, including Bloomberg, Morningstar, and Interactive Data.  In addition, the 30,000+ advisors on the Envestnet platform can now select the Endowment Index™ to benchmark client portfolios. Endowment Index™ data can be accessed through most major quote providers and websites under the symbol “ENDOW.” The Index’s Morningstar ID is F00000TPG6.

The Endowment Index helps trustees, portfolio managers, consultants and advisors to endowments, foundations, trusts, defined benefit/defined contribution plans, pension plans and individual investors more appropriately track the performance of and analyze globally-diversified, multi-asset portfolios. The Endowment Index™ is an objective benchmark comprised of three major asset class building blocks: Global Equity, Global Fixed Income, and Alternatives, which includes hedge funds, private equity and real assets. The Endowment Index™ is a total return index and all underlying components are comprised of exchange-traded funds or other investable securities.  Endowment Wealth Management, Inc. in collaboration with ETF Model Solutions, LLC earlier this year launched the Endowment Index™ as a benchmarking tool for investors in globally-diversified, multi-asset portfolios that include alternative investments.

Endowment Wealth Management, Inc. is an independent Private Wealth Management Firm using a Multi-Client Family Office service model, whose mission is to grow wealth for individuals, families, retirement plans, endowments, foundations and other institutions through the utilization of the Endowment Investment Philosophy™.  EWM can construct index-based portfolios for investors based upon the Endowment Index™ asset allocation.

ETF Model Solutions, LLC, is third party investment manager and ETF strategist that builds investment models for 401(k) plans, Investment Advisors within their practice, Family Offices, Endowments, Foundations, Trusts, and Individual Investors.  The Firm is the fund manager for the Endowment Multi-Asset ETF Collective Investment Fund, available for use in 401(k) and other retirement plans.

Contact:
Prateek Mehrotra, MBA, CFA®, CAIA®
Email
920.785.6010
www.EndowmentWM.com or www.ETFModelSolutions.com

Disclosure:  You typically cannot invest directly in an index. Indexes do not contain fees.  Information presented is for educational purposes only and is not intended as an offer or solicitation for the sale or purchase of any specific securities, investments, or investment strategies, nor shall it be construed to be the provision of investment advice.  Investments involve risk and unless otherwise stated, are not insured or guaranteed. Be sure to consult with a qualified financial advisor and/or tax professional before implementing any investment strategies. While the firms are related and share corporate offices, Endowment Wealth Management, Inc. and ETF Model Solutions, LLC are each individually registered as an investment adviser in the State of Wisconsin. A copy of each firm’s respective disclosure document, Form ADV Brochure Part 2, is available upon request.

Link to Release

Press Release: Endowment Index Historical Data Now Available Through Morningstar, Interactive Data and Bloomberg

By Endowment Index™, News

APPLETON, Wis., Nov. 11, 2014 /PRNewswire/

Historical index data for the Endowment Index™ — calculated by Nasdaq OMX® — is now available through major index and investment databases, including Bloomberg, Morningstar, and Interactive Data.  In addition, the 30,000+ advisors on the Envestnet platform can now select the Endowment Index™ to benchmark client portfolios. Endowment Index™ data can be accessed through most major quote providers and websites under the symbol “ENDOW.” The Index’s Morningstar ID is F00000TPG6.

The Endowment Index helps trustees, portfolio managers, consultants and advisors to endowments, foundations, trusts, defined benefit/defined contribution plans, pension plans and individual investors more appropriately track the performance of and analyze globally-diversified, multi-asset portfolios. The Endowment Index™ is an objective benchmark comprised of three major asset class building blocks: Global Equity, Global Fixed Income, and Alternatives, which includes hedge funds, private equity and real assets. The Endowment Index™ is a total return index and all underlying components are comprised of exchange-traded funds or other investable securities.  Endowment Wealth Management, Inc. in collaboration with ETF Model Solutions, LLC earlier this year launched the Endowment Index™ as a benchmarking tool for investors in globally-diversified, multi-asset portfolios that include alternative investments.

Endowment Wealth Management, Inc. is an independent Private Wealth Management Firm using a Multi-Client Family Office service model, whose mission is to grow wealth for individuals, families, retirement plans, endowments, foundations and other institutions through the utilization of the Endowment Investment Philosophy™.  EWM can construct index-based portfolios for investors based upon the Endowment Index™ asset allocation.

ETF Model Solutions, LLC, is third party investment manager and ETF strategist that builds investment models for 401(k) plans, Investment Advisors within their practice, Family Offices, Endowments, Foundations, Trusts, and Individual Investors.  The Firm is the fund manager for the Endowment Multi-Asset ETF Collective Investment Fund, available for use in 401(k) and other retirement plans.

Contact:
Prateek Mehrotra, MBA, CFA®, CAIA®
Email
920.785.6010
www.EndowmentWM.com or www.ETFModelSolutions.com

Disclosure:  You typically cannot invest directly in an index. Indexes do not contain fees.  Information presented is for educational purposes only and is not intended as an offer or solicitation for the sale or purchase of any specific securities, investments, or investment strategies, nor shall it be construed to be the provision of investment advice.  Investments involve risk and unless otherwise stated, are not insured or guaranteed. Be sure to consult with a qualified financial advisor and/or tax professional before implementing any investment strategies. While the firms are related and share corporate offices, Endowment Wealth Management, Inc. and ETF Model Solutions, LLC are each individually registered as an investment adviser in the State of Wisconsin. A copy of each firm’s respective disclosure document, Form ADV Brochure Part 2, is available upon request.

Link to Release

How To Invest Like The Ivy League Endowments with ETFs

By Alternative Investments, ETF Related

Seeking Alpha published an article by Prateek Mehrotra outlining how ETFs can help investors build institutional quality portfolios diversified into liquid alternative investments designed to improve long-term risk adjusted returns. The article summary

  • The country’s largest endowments aim to preserve capital while producing income and appreciation with less correlation to the stock market regardless of market conditions.
  • Performance among Ivy League endowments and retirement plans that invest like them varied widely last year but in the long run, they posted stellar risk-adjusted returns.
  • You can invest like an Ivy League endowment yourself with a basket of ETFs offering exposure to all of the major asset classes in their portfolios.

The entire article can be read on the Seeking Alpha website.

Endowment Wealth Management Records New Radio Spot Discussing Retirement

By News

Rob Riedl, Director of Wealth Management at Endowment Wealth Management talks about 61% of Americans without a retirement plan should develop a road map to help them to their retirement destination in a new radio spot running the week of October 13, 2014 on WHBY 1150, a radio station dedicated to news, sports and talk programming in the Appleton, Green Bay and Fox Cities area.

Click to listen:  EWM-Radio-Rob-Riedl-on-Retirement-2014.10.13

member01


Robert Riedl, CPA, CFP®, AWMA®

U.S. Inflation Watch: Price Index for Personal Consumption Expenditures in August-2014

By Inflation Watch

The Fed’s preferred inflation measure, which is the price index for personal consumption expenditures increased 1.5% in August over previous twelve months. August 2014 was the 28th straight month this number has been below Fed’s 2% target. Excluding volatile food and energy prices, the core PCE indicator has also increased at 1.5% year over year. This has slightly decelerated from 1.6% in July’14.

The CPI measure rose 1.7% year over year in Aug’14, which was a marked slowdown from the better than 2% pace recorded in the previous four months.

The CPI measure has historically run about half a percentage point below the PCE price index.

(Source: WSJ)

Comparing the Nation’s Largest Pension Fund Asset Allocation and Return History to the Endowment Index™

By Alternative Investments, Endowment Index™

The nation’s largest pension fund, the California Public Employees Retirement System, better known as CalPERS has been in the news this week with an announcement that they are going to be liquidating their $4B hedge fund allocation over the next year.  Apparently, the high costs and complexities, combined with their ability to scale the asset class relative to their $300B portfolio just isn’t worth the effort.

While on the surface this may seem like shocking news, in reality, this isn’t surprising – its simply another data point confirming the transition from traditional alternatives to liquid alts is real and likely to continue.  Given the higher costs, and other burdens (K-1 tax returns, lockups, accredited investor mandates, lack of transparency, scandals/Madoff, high minimums, and others) with the partnership form of traditional alternatives, its logical that more advisors and investors will continue to consider liquid alts as either a replacement for their traditional alternatives allocation, or to in an effort to enhance their traditional two-dimensional stock-bond portfolios.

CalPERS announcement prompted us to take a closer look at their portfolio as compared to the Endowment Index™ calculated by Nasdaq OMX®.  The Endowment Index represents the asset allocation portfolio holdings of over institutions managing over $400 billion in total assets.

Endowment Index™ vs. CalPERS Asset Allocation and 10 Year Return History

Endowment Index vs CalPERS


*For 10 year period ending June 30, 2014.  Returns are annualized.

Past performance no guarantee of future results.  The above is presented for informational purposes only and is not intended as investment advice.  Index data presented for comparison purposes only. Indexes don’t have fees. You cannot invest directly in an index.  Endowment Index data prior to May 19, 2014 contains backtested data, which contains certain weaknesses.  Click here for additional disclosure on back testing.

U.S. Inflation Watch-July 2014

By Inflation Watch

Consumer prices rose modestly in July, a sign inflation remains in check as the Federal Reserve winds down its bond-buying program. The price index for personal consumption expenditures–the Fed’s preferred inflation measure–increased 1.6% in July from a year earlier, the Commerce Department said Friday. Excluding volatile food and energy prices, so-called core prices climbed 1.5% year over year.

Both overall and core prices rose at the same annual pace in July as they did in June, suggesting inflation pressures remained at bay. Compared to a month earlier, each measure was up just 0.1%. Inflation continues to run below the 2% target the Fed sets as a gauge of price stability and healthy growth. The PCE price index has run below 2% for 27 consecutive months.

Still, prices have picked up since the start of the year, and the Fed projects they’ll steadily climb toward its target by the end of 2015. As recently as February, the index showed prices growing at just 1% year over year.

A separate measure also shows inflation in check. The Labor Department’s consumer-price index rose 2% in July from a month earlier. In May and June, the index had risen 2.1% year over year.

The CPI historically runs about half a percentage point higher than the PCE price index, which employs different statistical methods.

(Source: WSJ, BLS)