
1. What is a myRA?
The myRA (rhymes with IRA) is a new workplace retirement savings account discussed by President Obama in the State of the Union address and subsequently authorized by executive order. The administration hopes that employers who currently don’t offer a workplace retirement plan will make myRAs available to their employees. Only limited details are currently available.
The myRA is a regular Roth IRA with some special features. Your contributions are made on an after-tax basis through payroll deduction. Your contributions are tax-free when withdrawn, and earnings are also tax-free if certain requirements are met. Contributions are invested in newly created government bonds that earn the same variable interest rate that’s available through the government’s Thrift Savings Plan Government Securities Investment Fund (G Fund). For reference, the G Fund earned 2.45% in 2011 and 1.47% in 2012. Your account principal is fully protected — the value of your account can never go down, and the bonds are backed by the full faith and credit of the U.S. government.
2. Is it available now?
No. It is anticipated that the program will start in 2015.
3. Do employers have to offer the myRA?
No. The plan is voluntary. Employers need to sign up by the end of 2014 in order to participate in the pilot program.
4. Do employees have to contribute?
No. Unlike the Auto-IRA that has also been proposed by President Obama, but not yet enacted, employee contributions are totally voluntary.
5. Who can contribute?
According to the White House, myRA accounts are available to “households earning up to $191,000.”
6. Will employers contribute to the myRA?
No.
7. How much can I contribute?
You can open an account with as little as $25, and additional contributions can be as little as $5. You can keep your account if you change jobs. Again, details are limited, but presumably you can contribute up to the annual IRA limit (the limit for 2014 is $5,500), and that would include all of your myRA, traditional IRA and regular Roth IRA contributions. However, once your account reaches $15,000 (or you have had the account for 30 years, whichever comes first) you’re required to transfer the account into a private-sector Roth IRA.
8. When can I access my funds?
This is not entirely clear. According to the Obama administration’s instructions to the Treasury, you can access your funds if you have an emergency. It is not currently clear, however, if the regular Roth IRA distribution rules — which don’t limit withdrawals to emergencies — also apply. (The regular rules allow you to access your funds at any time. Your own contributions are tax-free when withdrawn; earnings are tax-free if you are at least 59½, or disabled, or a first-time homebuyer, and you also satisfy a five-year holding period.) You can transfer your myRA account balance to a private-sector Roth IRA at any time.
9. Why should I invest in a myRA instead of a regular Roth IRA?
The distinguishing features of a myRA are the ability to contribute through payroll deduction, access to the new retirement bond, safety of principal, and the ability to make very small contributions. There will also be no fees to establish or maintain the myRA. However, the myRA, with its single investment option and $15,000 cap, lacks the flexibility of a regular Roth IRA. If you can afford the minimum investment to establish an account, a regular Roth IRA may be the better option.
http://www.nerdwallet.com/blog/finance/2014/myra-what-need-to-know/
- Deductions
- Diversions
- Deferrals
- Deflections
- Diminution
To budget accordingly, you must know which ones have far-reaching ramifications.
The expiration of the Federal tax provisions will almost certainly have an adverse impact on a wide swath of taxpayers; increasing the effective tax rate of both large and small businesses, with additional collateral damage to individuals and charitable organizations. Notable expired provisions include higher Section 179 limits, bonus depreciation, energy tax incentives, the R&D credit, and many others.
At the time of this writing, the prospect for retroactive extension of these provisions is unclear at best. Sen. Harry Reid introduced an extender bill (S. 1859) in December that failed to pass by unanimous consent. The Senate Finance Committee is working on another extender bill, but members of both parties have expressed their preference for comprehensive tax reform in favor of tax extender legislation. Whether or not such legislation will be enacted prior to the upcoming mid-term election is anyone’s guess, but by historical standards prospects for near-term, comprehensive tax reform are dim.
Access this comprehensive list now to find out which Expiring Federal Tax Provisions (2013-2023) impact you »
Capitalization rates, used by real-estate investors to measure the annual return of income-producing properties, declined for many property types in 2013, according to data from Real Capital Analytics in New York. Meanwhile, the spread between cap rates and yields on 10-year Treasury notes narrowed. The average cap rate for all property types was 6.74% last year, down from 6.76% in 2012. Cap rates fell fastest for office buildings, which had an average cap rate of 6.93% in 2013 compared with 7.15% in 2012.
(Source: Wall Street Journal)
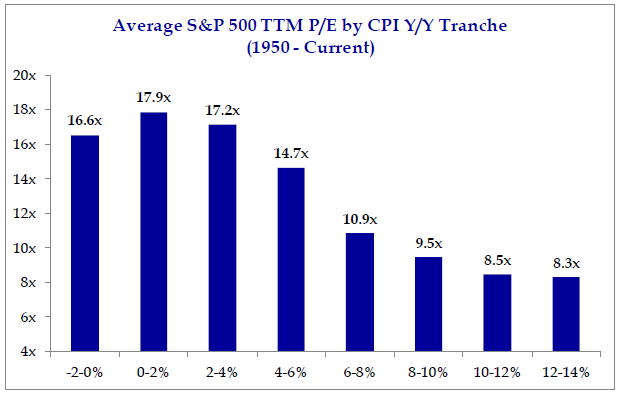
Equity valuations are still reasonable, especially when considering the inflation environment. Historically, inflation between 0%-2% (CPI is currently running at 1.2% year over year) has been a sweet spot for valuations. Even inflation readings up to 4% have been supportive for valuations. Concerns for multiples would arise if we see either deflation or inflation greater than 4%.
(Sources: Strategas Research Partners, LLC & Brinker Capital, Inc.)
Institutions Are Poised to Increase Real Estate and Real Asset Allocations
Institutions Will Move out of Cash, Growing Role for Hedge Funds and Private Equity
Major institutional investors around the world are poised to increase their allocations to alternative investments, with a bias towards real estate and real assets, during 2014, according to a global survey of institutions conducted by BlackRock.
Approximately half of institutions surveyed– 49 percent – expect to increase their real estate allocation and over 40 percent indicated they will increase their investment in real assets this year. At the same time, about one-third of the institutional investors surveyed intend to reduce their cash holdings in 2014.
“Institutional investors are seeking to build portfolios better suited for an investment landscape characterized by low yields, sluggish growth, volatile markets, and rising correlation between stocks and bonds,” said Robert Goldstein, Senior Managing Director and head of BlackRock’s Institutional Client Business and BlackRock Solutions.
“Divergent economic and geopolitical conditions globally offer institutions a menu of real estate and real asset opportunities that meet a variety of investment objectives,” said Goldstein.
“In real estate, while core, income producing investments in developed markets are still in favor because of their liquidity and safe cash flows, we anticipate that institutions looking for income-producing alternatives will turn their attention to more opportunistic real estate investments outside their home markets,” said Goldstein.
“We’re also seeing a growing interest in infrastructure debt. These types of investments can potentially offer institutions high fixed yields, with stable cash flows and long duration.”
Seeking Out Better “Portfolio Buffers”
“The results of the survey likely reflect a recognition that, going forward, the portfolio diversification benefit traditionally offered by equities and bonds might be less powerful than in the past,” Goldstein said. “Indeed, the price correlation between US equities and bonds, which had been negative from 2009 through mid-2013, has been positive ever since then – suggesting that institutions definitely will be looking to other asset classes for more effective ‘portfolio buffers’ in coming months.”
A Growing Interest in Hedge Funds and Private Equity
“Within the alternatives category, we believe hedge funds and private equity also will command a growing role in institutional portfolios in 2014, with investors casting a wide net for appropriate diversification tools,” said Goldstein.
Nearly 30 percent of institutions surveyed intend to increase their hedge fund allocations this year.
In the Americas, over 40 percent of institutions are likely to increase their hedge fund allocation; none is planning a decrease. The trend is less true for EMEA, where 35 percent of institutions intend to allocate less to hedge funds and just 20 percent will allocate more.
Approximately one-third of institutions surveyed anticipate allocating more to private equity. Private equity is less popular with EMEA institutions and smaller investors (those with less than $20 billion in AUM), with these investors indicating they will either maintain or reduce current private equity allocations.
About the Survey
BlackRock surveyed approximately 100 institutional investors representing the firm’s Americas, Europe/Middle East/Africa (EMEA), and Asia-Pacific (APAC) markets, including corporate and private pension funds, insurers, investment managers, and government entities. In total, the investors surveyed represent more than $6 trillion in assets under management (AUM), with an average AUM of $70 billion.
About BlackRock
BlackRock is a leader in investment management, risk management and advisory services for institutional and retail clients worldwide. At December 31, 2013, BlackRock’s AUM was $4.324 trillion. BlackRock helps clients meet their goals and overcome challenges with a range of products that include separate accounts, mutual funds, iShares® (exchange-traded funds), and other pooled investment vehicles. BlackRock also offers risk management, advisory and enterprise investment system services to a broad base of institutional investors through BlackRockSolutions®. Headquartered in New York City, as of December 31, 2013, the firm had approximately 11,400 employees in more than 30 countries and a major presence in key global markets, including North and South America, Europe, Asia, Australia and the Middle East and Africa. For additional information, please visit the Company’s website at www.blackrock.com.
Disclaimer
This material represents an assessment of the market environment at a specific time and is not intended to be a forecast of future events or a guarantee of future results. This information should not be relied upon by the reader as research or investment advice. Investing in alternative investments involves higher risks than traditional investments and may not be suitable for all investors. Alternative investments may be highly leveraged and engage in speculative investment techniques, which an magnify the potential for investment loss or gain.
BlackRock® is a registered trademark of BlackRock, Inc. All other trademarks are the property of their respective owners.

The average dispersion between S&P 500® stocks over the twelve months of the year was just below 5%, which is the lowest value across the 23-year data.
In such circumstances, the relative value of active management in the equity markets is constrained. Simply put, accurate bets deliver less alpha.

The Fed has begun tapering asset purchases, starting with $10 billion in January, split evenly between U.S. Treasuries and mortgage-backed securities. If the Fed continues to taper by an additional $10 billion at each meeting, QE3 would end in October 2014, still providing liquidity throughout most of the year. The Fed is expected to keep short-term rates near zeor until at least 2015.