When we talk about emerging market equities today, we find that people are disappointed: there has been under-performance of late. Additionally, there remain key risks:
• The U.S. Federal Reserve (Fed) raises short-term interest rates
• Commodity prices decline
While each of these well-publicized risks can contribute to further volatility, it’s also quite possible that they are already reflected in emerging market equity valuations today.
Dividend Yield as a Barometer for Valuation Opportunities
There are many ways to measure equity valuation, and in this case we look at dividend yields. Specifically, we break the available history (starting in 1988) of the MSCI Emerging Markets Index into high- and low-dividend-yield years.
• High-Dividend-Yield Years: Years that began with a dividend yield above the median dividend yield for all calendar years.
• Low-Dividend-Yield Years: Years that began with a dividend yield below the median dividend yield for all calendar years.
• Squarely High Dividend Yields: The median dividend yield was about 2.3% for the full period. 2015 began with a dividend yield of 3.1%1. As of June 30, 2015, the MSCI Emerging Markets Index had a dividend yield of about 3.0%.
The Bottom Line: Since high-dividend-yield years indicate lower prices relative to dividends, the key question is whether they exhibited different returns, on average, than the low-dividend-yield years, when price levels relative to dividends were higher.
Dividend Yield is a Potential Measure of Relative Valuation in Emerging Markets
(12/31/1987 to 6/30/2015)
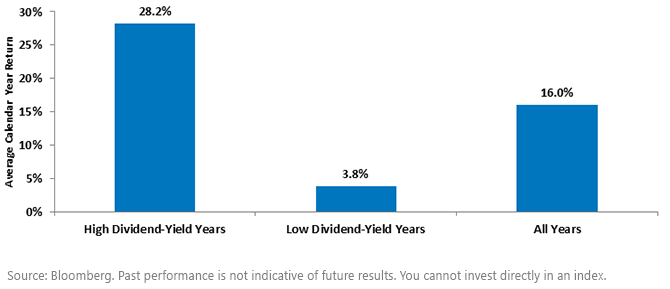
- High-Dividend-Yield Years: When a year began with a high dividend yield, the average return for that year was over 28%. In fact, such values were followed by negative years in only five instances, the worst of which was a negative 25% return in 1998.
• Low-Dividend-Yield Years: When a year began with a low dividend yield, the average return for that year was below 4%. Such values were followed by negative years seven times, the worst of which was 2008’s negative 53% return.
• Years That Started with Dividend Yields above 3.0%: Actually, we started 2015 not only with a high dividend yield but with one above 3.0%. There have been only five such years before, and although past performance can never predict future returns, the returns were strong in those years, averaging 58%. The lowest return of any of these years was 2012, when the MSCI Emerging Markets Index was up over 18%.
Is It Time for the Turnaround?
While we strongly believe that emerging markets will come back into favor, it is extremely difficult to predict when this turnaround will occur. There remain very real risks, but the more critical question regards whether the higher dividend yield reflects these risks.
Some things that we’re being particularly watchful of:
- Stabilization and/or rebound in commodity prices.
- Further stimulus in China or other activity relating to China’s currency.
- U.S. Federal Reserve raising short-term interest rates to help people put this in the rear view mirror so that other things can move back into focus. There is concern as to how emerging market currencies might react.
1Refers to 12/31/2014.
Important Risks Related to this Article
Dividends are not guaranteed, and a company’s future ability to pay dividends may be limited. A company currently paying dividends may cease paying dividends at any time.
Investments in emerging, offshore or frontier markets are generally less liquid and less efficient than investments in developed markets and are subject to additional risks, such as risks of adverse governmental regulation and intervention or political developments.