1.7 million
General Motors has recalled a further 1.7 million vehicles to fix a variety of problems, chief among them a wiring defect that could result in seat airbags failing to deploy.
(Source: Wall Street Journal)
General Motors has recalled a further 1.7 million vehicles to fix a variety of problems, chief among them a wiring defect that could result in seat airbags failing to deploy.
(Source: Wall Street Journal)
The incidence of colon cancer, declining since the mid-1980s, plunged a further 30% last decade among Americans 50 and older as more people had colonoscopies, a new study found.
(Source: Wall Street Journal)
Amazon.com Inc. said it would raise the annual price of its Prime shipping and streaming-video service by $20 to $99, the first increase in its nine-year history.
(Source: Wall Street Journal)
Game maker King Digital Entertainment is planning to start trading this month on the New York Stock Exchange, valuing itself Wednesday at as much as $7.6 billion after it set a price range for its initial public offering.
(Source: Wall Street Journal)
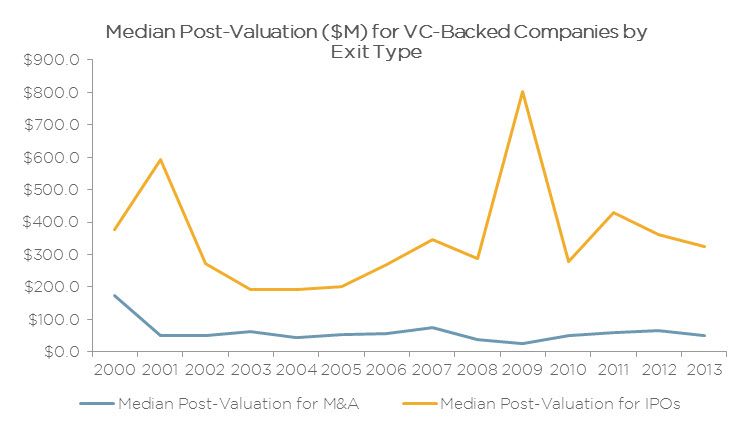
Throughout the early 2000s, the median valuation of companies at IPO was approximately three times larger than it was for companies that were acquired, according to PitchBook data. The difference has been even wider in recent years—greater than 5x each year since 2008 and sitting at 6.5x in 2013.
There are obviously manifold reasons for this development, including that publicly traded stocks have been trading at higher multiples in recent years. Importantly, the increasing discrepancy between the two exit strategies’ valuations cannot simply be attributed to investors pursuing fewer but larger offerings. In fact, the median valuation at IPO has actually declined since 2011 as investors have capitalized on the recent strength in the markets to take more companies public; the 85 IPOs of U.S.-based VC-backed companies in 2013 is the most since the dot-com boom.
Another important consideration when comparing exit valuations is that many mergers & acquisitions will involve struggling companies, and some transactions may not even allow investors to recoup their entire investment. While there are exceptions, companies that go public tend to boast strong performance and strong future growth prospects, which naturally leads to higher valuations.
One notable outlier when it comes to valuations at exit comes in 2009, when the median valuation for VC-backed IPOs came in at a whopping $802 million. This may seem odd, given the low regard investors had for public equities during this period. However, considering that only top-notch companies would risk going public in those conditions, the lofty level of valuations seems more reasonable.
(Source: Pitchbook)

High-yield bond spreads have tightened significantly from the record-wide levels reached during the 2008 financial crisis. However, spreads are still wider than the lows reached in the 2005-2007 period. We believe that high-yield spreads may have some room to tighten further as credit is improving, economy continues to grow, there is a lot of cash on corporate balance sheets and defaults remain low.
(Source: Bloomberg)
In a new Wall Street Journal/NBC News poll, U.S. President Barack Obama’s job-approval rating ticked down to 41% in March from 43% in January, marking the lowest level of his presidency. And, adding to the Democrats’ midterm worries, a Republican won a closely watched special house race in Florida.
(Source: Wall Street Journal)
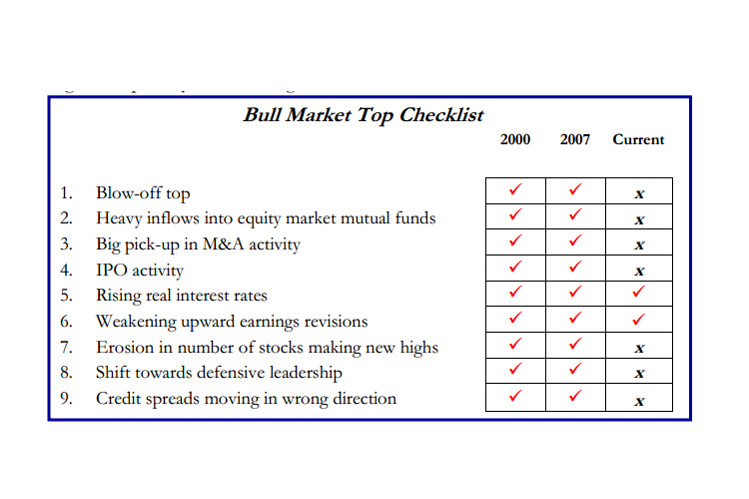
(Source: Strategas)
Investors who are worried about the market’s parabolic rise in the past five years and whether we are at or near a top, can use the above table to judget where we are in the cycle and whether the tide is about to turn the other way.
Google Inc. on Monday disclosed $9.5 million in cash bonuses, tied to the company’s performance in fiscal year 2013, for certain executives.
(Source: Wall Street Journal)
151.3%: The Dow Jones Industrial Average’s gains over the past five years, one of only six bull markets in history that have lasted this long.
782%: American Express Co.’s gain since March 2009, the biggest rally among the 30 Dow components. Walt Disney Co. is second, up 427%, and Home Depot Inc. rounds out the top three, up 352%.
47%: Exxon Mobil Corp.’s rally through the past five years, the worst-performing blue chip among components that spent all five years in the Dow.
177.6%: The S&P 500′s gain over the past five years.
50: The number of record highs for the broad S&P 500 over the past 12 months, including Friday’s record-setting close of 1878.04.
15.4: The S&P 500′s forward price-to-earnings ratio, up from 10.3 at the bear-market bottom, according to FactSet.
324.4%: The S&P 500 consumer discretionary sector’s rally, the top performer among the index’s 10 large-cap sectors. Financials is second best, up 259%, and industrials is third, up 242%.
68%: The rally for the S&P”s telecommunications sector, the worst performing large-cap sector.
241.8%: The technology-heavy Nasdaq Composite’s rally since the March 2009 bottom.
538.2%: Apple Inc.’s rally over the past five years.
250.6%: The gains for the Russell 2000 index of small-capitalization stocks off the bear-market low.
30.5%: The level of bearish sentiment — or expectations that stock prices will fall over the next six months, according to the weekly survey conducted by the American Association of Individual Investors released Thursday. By comparison bearish sentiment reached a record level of70.3% in March 2009.
6.7%: The current unemployment rate, as per Friday’s jobs report. By comparison, the unemployment rate was 8.7% in March 2009.