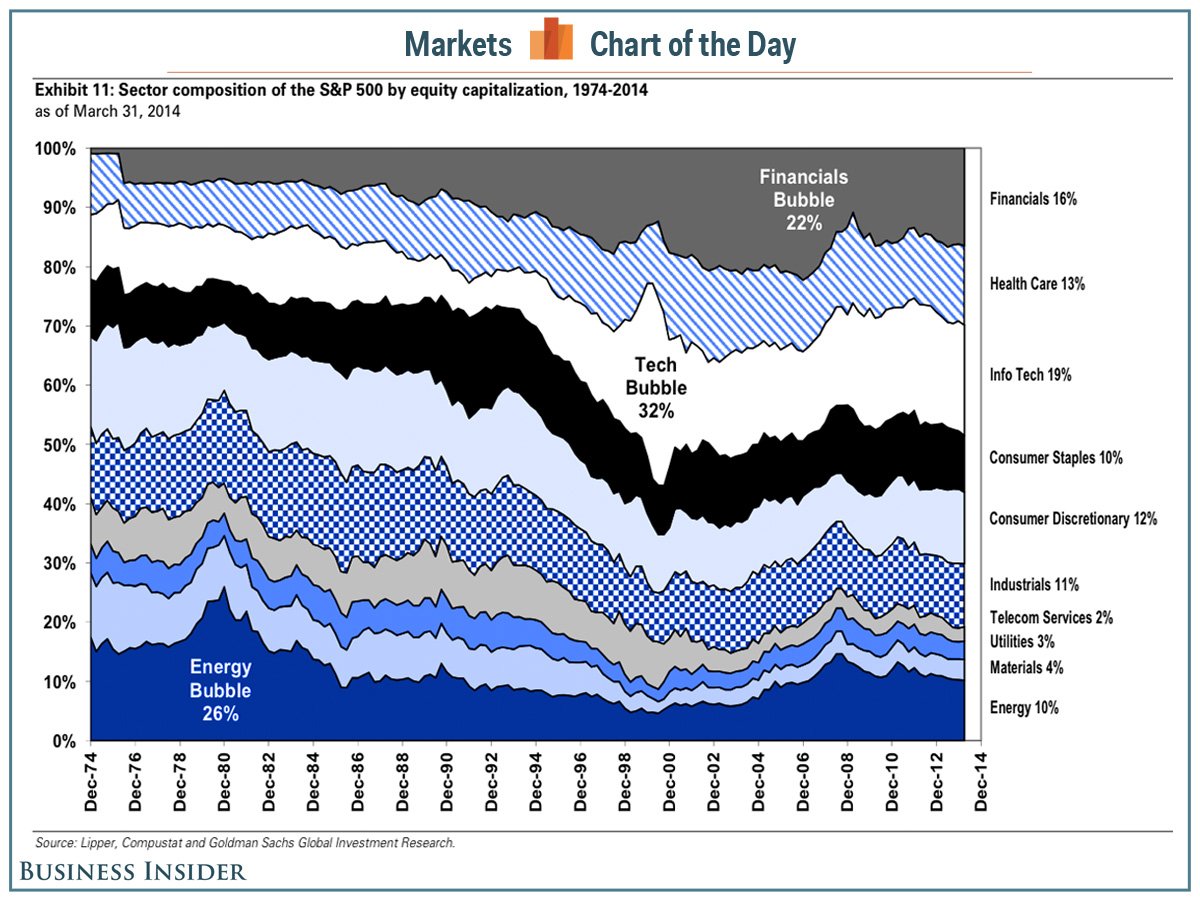
Following is an interesting chart to spot bubbles within the stock market. Any time a sector’s weighting goes above 20%, it could signal trouble ahead. There were three instances since 1974 when the sector weightings for Energy, Technology and Financials exceeded that threshold and cause a bubble.