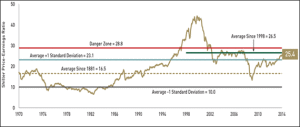
The strong performance of stocks in 2013 has many commentators describing the current market as being in a bubble. And often they cite the Shiller P/E [price-to-earnings] ratio, a measure developed by Yale economist and Nobel Prize winner Robert Shiller.
As of March 19, 2014, the Shiller P/E stood at 25.4, much higher than the historical average of 16.5. If a value of 16.5 indicates that the market is fairly valued, as some commentators believe, then the current market is more than 50% overvalued. (See Chart below)
The Shiller P/E is a twist on the traditional P/E. It takes the previous 10 years’ earnings on the S&P 500® Index, adjusts them to current dollars, averages them, and then divides this result into the S&P 500’s current market capitalization. By relying on 10 years of earnings, the Shiller P/E mitigates the earnings volatility that can distort the traditional market P/E.
One problem with this measure, however, is that it may be used in a way that is too restrictive. If a reading of over 16.5 means that the market is “overvalued,” then stocks have been “overvalued” for most of the past two decades. Since January 1991, the Shiller P/E has been above average for 268 of the past 278 months.
Yet, during that time, the S&P 500 has more than quintupled, rising from 326.4 (on January 2, 1991) to more than 1,860 (as of March 19, 2014). Including dividends, this amounts to a compound annual return of 10.1%. Clearly, investors using the Shiller P/E in order to avoid an “overvalued” market would have missed out on significant gains.
The Shiller P/E is not, however, without its critics. Wharton professor Jeremy Siegel, for example, has pointed out that the metric may be biased upward because of accounting rule changes made in the late 1990s. These changes require that assets be written down when they lose value and then charged against income. Increases in asset prices, however, are not recorded unless the assets are sold.
These changes create a downward bias in reported GAAP earnings, says Siegel, resulting in an upward bias in the Shiller P/E. Siegel also believes these accounting changes make comparisons of today’s earnings with those reported before the changes invalid. He recommends that for an apples-to-apples comparison with today’s market, only the last 15 years of Shiller P/Es be used. The average over this period (December 1998 to December 2013) is 26.5, further suggesting that current valuations may not be as unreasonable as many suggest.
Those arguing for a market bubble also cite corporate profit margins, which are near record highs and which some believe are likely to return to more normal levels soon. But many factors are behind the higher profitability, including low interest rates and favorable tax rates in international markets, neither of which is likely to change soon.
Operating leverage is also responsible for the improved profits, according to Milton Ezrati, Lord Abbett Partner, Senior Economist and Market Strategist. “The capital intensity of U.S. business enhances productivity, but it also raises fixed costs relative to total costs, and these fixed costs don’t go away during an economic downturn the way employee costs do,” said Ezrati. “Fixed costs must be covered even when revenues decline, so when sales fall, earnings may drop precipitously,” he added. “But when revenues rise, much of the increase goes right to the bottom line, as the fixed costs are covered.”
This positive effect may persist for a while, according to Ezrati. The economy is still using only 78.5% of its existing capacity, according to the Federal Reserve, suggesting that firms still have more equipment to bring online, which would allow even more revenues to flow to the bottom line.
(Source: Lord Abbett)

