Record flows into Equity Funds in 2013

By General

Investors put record amounts into U.S.-listed equity mutual funds and exchange-traded funds in 2013 while pulling record amounts from U.S.-listed bond funds, according to data released by TrimTabs Investment Research on Tuesday. The record flows serve as one sign that investors are rotating their holdings from bond funds into stock funds, according to David Santschi, chief executive officer of TrimTabs. Investors put a net $352 billion into equity funds, eclipsing the previous record set in 2000. Meanwhile, bond funds saw a net outflow of $86 billion in 2013, beating the previous record set in 2013.

(Source: Marketwatch)

2013: Private Equity’s Record Year

By General

Private-equity firms are set to return a record amount of cash to their investors for 2013, after taking advantage of buoyant markets to sell hundreds of billions of dollars of investments. From initial public offerings to company debt deals that pay private-equity investors hefty dividends—this year will be remembered for the gains earned by firms that specialize in buying and selling companies, and by the pension funds, university endowments and wealthy individuals that invest in them. Investors in private-equity funds are expected to receive more than $120 billion for 2013, topping last year’s record of $115 billion, according to estimates by Cambridge Associates LLC, which gets a glimpse of firms’ finances as an adviser to private-equity investors. In the first half of 2013, private-equity firms returned $60.8 billion to investors.

Private Equity Cash Back 2013

Active vs. Passive Asset Management

By General

One of the primary decisions investors and their advisors are faced with in the portfolio construction process is the type of investment approach – active or passive – to employ. Is there value to be added in hiring active managers, or should a portfolio be passively constructed in order to simply gain the desired market exposures in a cost-efficient manner? Or perhaps a superior outcome can be achieved through a “core/satellite” approach, in which the components of the allocation representing the more efficient market segments are passively invested while active managers are selected for the satellite exposures where inefficiencies may be more prevalent. If so, which asset classes might best be designated as “passive” and which ones “active”? To add complexity, if a decision is made to employ some element of active management, the investor and advisor must then select specific managers to comprise those allocations.


Over the years, there has been a significant amount of research conducted on the active vs. passive question. The debate has generally boiled down to being a referendum on the merits of the efficient market theory (EMT), which posits that since market prices instantaneously react to the knowledge and expectations of all investors, it is impossible to systematically outperform the benchmark consistently. Adherents of EMT typically favor passive management and employ ETFs, index funds and other passive strategies in the portfolio construction process. On the other side of the debate are those that point to the long-term success of certain active managers such as Warren Buffett, Peter Lynch and John Templeton as evidence that markets are not efficient and that active management can indeed add value.


Conclusions from the results of a recent study on this topic: (1) certain Morningstar categories exhibit incidence of manager skill over time, and are therefore candidates for active management; (2) the alphas of the skilled group of managers are not only statistically, but also economically significant; (3) the incidence of manager skill is different for foreign and domestic equities across various economic environments; and (4) in terms of manager selection within categories designated as active, the best dimensions that predict future manager performance are the previous period’s active return, expense ratio and capture ratio.


Overall, our results tend to support the core/satellite approach to portfolio construction. The core (more efficient) categories such as those within the domestic large cap equity segment warrant passive allocation, while the satellite (less efficient) categories such as domestic small cap and international developed and emerging markets are good candidates for active management.

S&P 500 Operating Margins

By Uncategorized

S&P 500 Operating Margins

Do you think that the high Operating Margins will hold in 2014?

The major drivers for the high Operating Margins in 2013, viz. productivity, technology and cheap imports, should help again next year.  Other factors like cheap energy and lower effective tax rates should continue to help as well. Plus, we do not see excesses in business investment, inventory or debt (personal or commercial) in 2014.

Persistently high profit margins should help equities in 2014.


Start of Tapering…

By General
I am posting below the Federal Reserve Bank of New York Statement Regarding Purchases of Treasury Securities and Agency Mortgage-Backed Securities: 

On December 18, 2013, the Federal Open Market Committee (FOMC) directed the Open Market Trading Desk (the Desk) at the Federal Reserve Bank of New York to purchase additional agency mortgage-backed securities (MBS) at a pace of about $35 billion per month and longer-term Treasury securities at a pace of about $40 billion per month, beginning in January 2014.  The existing December schedules for agency MBS purchases at a pace of $40 billion per month and Treasury securities purchases at a pace of $45 billion per month remain in effect until that time.  The FOMC also directed the Desk to maintain its existing policies of reinvesting principal payments from the Federal Reserve’s holdings of agency debt and agency MBS in agency MBS and of rolling over maturing Treasury securities at auction.  The Committee’s sizable and still-increasing holdings of longer-term securities should maintain downward pressure on longer-term interest rates, support mortgage markets, and help to make broader financial conditions more accommodative.

Purchases of agency MBS will continue to be concentrated in newly-issued agency MBS in the To-Be-Announced (TBA) market, and purchases of longer-term Treasury securities will continue to be distributed using the existing set of sectors and approximate weights.  These purchase distributions could change if market conditions warrant.

The amount of agency MBS to be purchased each month and the tentative schedule of Treasury purchase operations for the following calendar month will continue to be announced on or around the last business day of each month.  Additionally, the planned amount of purchases associated with reinvestments of principal payments on holdings of agency securities that are anticipated to take place over each monthly period will be announced on or around the eighth business day of the month.

Consistent with current practices, the purchases of agency MBS and Treasury securities will be conducted with the Federal Reserve’s eligible counterparties through a competitive bidding process and results will be published on the Federal Reserve Bank of New York’s website.  The Desk will continue to publish transaction prices for individual operations at the end of each monthly period. All other purchase details remain the same at this time.

Additional information on the purchases of agency MBS and longer-term Treasury securities can be found in a set of Frequently Asked Questions for each asset class in the following locations:

FAQs: Agency MBS Purchases »

FAQs: Purchases of Longer-term Treasury Securities »

Baltic Dry Index-Is this a Leading Indicator?

By Uncategorized

Baltic Dry Index-5 Year Price Chart Dec-2013

The BalticDry Index is issued daily by the London-based Baltic Exchange and provides “an assessment of the price of moving the major raw materials by sea”, like, iron ore, coal, grain, cement, copper, sand and gravel, fertilizer and even plastic granules.

Since it targets real-time shipping rates, which fluctuate based on supply and demand, subjectivity can’t creep into the readings. Day in and day out, it provides a snapshot of global economic activity at the earliest possible stage.

Year-to-date, the index is up nearly 230%. It now rests at its highest level since late 2010.

Can this be a sign of global recovery improving in 2014?


Momentum as an Investment Style

By General

Momentum as an Investment Style


Over the years there has been a significant amount of academic research conducted on the factors driving stock price movements. Researchers have focused on identifying reasons why stocks with certain characteristics tend to outperform persistently.  For example, value-oriented stocks (e.g., those having characteristics such  as low P/E ratios, high book value-to-market value multiples, etc.) have generated strong consistent outperformance of growth-oriented stocks over time. Eugene Fama and Ken French were among the first to highlight the value factor in 1992 in a seminal paper. Fama and French and others have also highlighted  how small caps have outperformed large caps. Besides the value and size factors, several other factors, or styles, have generated statistically significant premiums over long periods of time, including liquidity (e.g., the tendency for less liquid securities to perform better than those that are more liquid), defensive (e.g., stocks that are high quality outperform those of lower quality) and asset growth (e.g., stocks of companies with robust growth in assets underperform those having lower growth).


Momentum has been another style that has performed very well, but hasn’t received the widespread publicity of value and size. The intuition behind momentum as a strategy is that assets that have performed well recently tend to continue to perform well, and conversely, those that have underperformed tend to continue to underperform. In an important 1993 paper, Jegadeesh and Titman first called attention to the momentum factor.  In 1997, Carhart added momentum as a factor to the Fama-French three-factor (i.e., market, value and size) model for understanding performance persistence in mutual funds. Like many of the other factors, momentum is evident across many asset classes, including equities, bonds, currencies and commodities.


Momentum portfolios are generally implemented in one of two ways. Some institutional managers will construct long-short portfolios whereby they go long a group of stocks that have been top performers over the recent past, and go short a group of bottom performers.  Such a long-short portfolio captures the momentum premium, and has little if any correlation with traditional asset classes. Some managers, such as AQR, have created portfolios extracting momentum across a diverse set of asset classes, which because of the lack of correlation, creates an overall strategy with attractive risk-adjusted returns. The other primary way of implementing a momentum strategy is simply to go long the group of recent top performers, foregoing the short portfolio. While this strategy has significant beta exposure, it is more easily implemented for investors who either cannot, or prefer not to, use short positions.


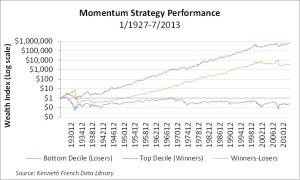
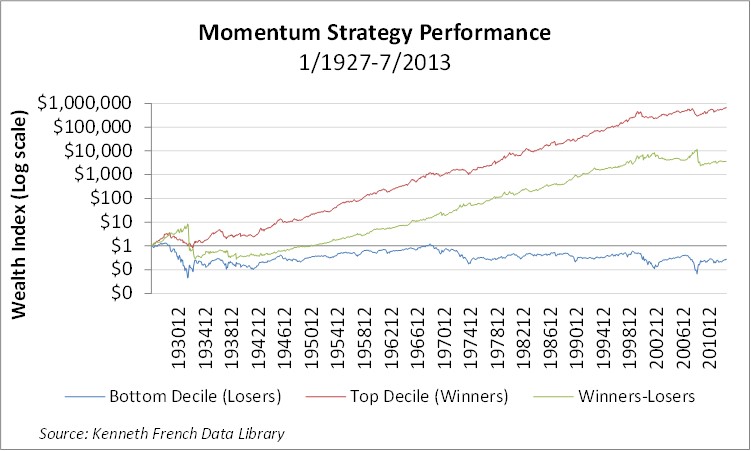
The graph below shows the performance of the top decile stocks (“winners”), the bottom decile stocks (“losers”), and the long-short portfolio of “winners” minus “losers” over the period covering January 1927 through July 2013.

Momentum Strategy Performance


Will the 2013 Equity Rally Repeat in 2014?

By Market Outlook

History seems to support the idea that 2014 will be less historic than 2013. Since 1927, there have been 23 years in which the S&P 500 has risen 20% or more, according to Birinyi Associates. It averaged a further gain of 6.4% in the next year. That is only slightly better than the 5.5% gain the S&P averaged for all years since 1927.

On only one of those 23 occasions of 20%-plus annual gains did the S&P improve its performance in the following year. In 1997 it rose 31% after a 20% gain in 1996. It rose again in 1998, by 27%, and in 1999, by 20%. Those were the days.

The S&P 500 has been known to decline in the year after a 20% gain. That has happened eight times. Six times it put in another 20% gain.

Data comparing the expansion of the S&P 500’s price/earnings ratio with past years, and comparing the performance at the current stage in the economic cycle, suggest gains of 6% to 9%.

It is possible that 2014 will be another year like 1997 and stocks will rise even faster than in 2013. Many in the market think the new Fed chairwoman, Janet Yellen, slated to take office Feb. 1 pending Senate confirmation, will delay withdrawing stimulus and fuel another big market year.

But before betting that 2014 will be better than 2013, investors might consider that it has happened once since 1927.

After the Surge-WSJ

(Source: Wall Street Journal)

What happens to Real Assets when the US Dollar rises?

By General

When the US Dollar has rallied in the past, real assets, especially gold and commodities have performed poorly, as the following table shows. Although real assets can provide a hedge against a weak dollar, they also can underperform when the dollar strengthens. Similarly, although real assets can provide some protection against inflation, they can also perform poorly when inflation is low. And in the current low-growth environment, inflation has been declining, according to data from the Bureau of Economic Analysis, and some observers believe it could remain low for a while despite the Fed’s easy money policy.

Performance of Real Assets when the US Dollar Rises

Source: Morningstar. Data as of November 2013.

1 U.S. Dollar Index (DXY).
2 S&P GSCI Gold Total Return Index.
3 S&P GSCI Total Return Index.
4 Barclays U.S. Corporate Baa Bond Total Return Index.
5 S&P 500 Total Return Index.

Past performance is no guarantee of future results.

The historical data are for illustrative purposes only, do not represent the performance of any particular investment, and are not intended to predict or depict future results. Indexes are unmanaged, do not reflect the deduction of fees or expenses, and are not available for direct investment. Performance during other time periods may be different or negative. Investors may experience different results. Due to market volatility, the market may not perform in a similar manner in the future.