Category

Uncategorized

Comparison of August 2015 to 1997, 1998 and 2011

By Uncategorized

The difficult market environment in August reminded us about the three other Augusts – August 1997 (Asian crisis), August 1998 (Russian crisis) and August 2011 (European debt crisis). In each of those episodes, there were some type of global risk events, and as a result, US market suffered significantly.

In 1997, Asian financial crisis started in Thailand with the collapse of the Thai baht after the Thai government was forced to cut the Thai baht’s peg to US dollar after exhausting its foreign reserve. As the crisis spread to Indonesia, South Korea and Malaysia, most of Southeast Asia and Japan experienced declining currencies, stock markets crashes and a jump in private debt. The crisis raised the fears of global economic meltdown. As a result, the US equity market dropped by 5.6% in August. However, the US market recovered quickly with a 5.5% rally in September.

In 1998, the Asian financial crisis and the following reduced demand for crude oil and nonferrous metals, negatively impacted the Russian exports and foreign reserves. A series of political missteps and inability to implement a set of economic reforms severely erased investor confidence and led to capital flight. Without enough foreign reserve to support its currency, on 17 August 1998, the Russian government devalued the ruble and defaulted on domestic debt. The Russian default caused global liquidity dry up and credit spreads widen, which brought down the then-known hedge fund, Long Term Capital Management. US equity markets tumbled 14.4% in August, but again recovered nicely in September and October.

In 2011, the European debt crisis intensified after it started in the wake of the Great Recession around late 2009. In August, the government bond yields in Italy and Spain breached 6% level as the European leaders struggled to reach an agreement to expand the bailout fund. The US equity market dropped by 12.4% during the months of August and September. However, once again, it recovered in October, gaining 10.9%.
This year, the stock market rout started in China when the Chinese government unexpectedly devalued its currency, which triggered concerns over global economic slowdown. The US equity market declined by 6.1%.

Event S&P 500 Index

(August)

S&P 500 Index

(whole year)

Valuation (current PE) Short Term Interest Rate ISM Manufacturing Index
1997 -Asian Crisis -5.6% 33.4% 21.9 5.2% 56.3
1998 – Russian Crisis -14.4% 28.6% 22.0 4.8% 49.3
2011- European Debt crisis -12.4% (Aug and Sept) 2.1% 13.6 0.0% 50.6
2015 – Chinese Slowdown -6.1% ?? 18.6 0.0%


51.1

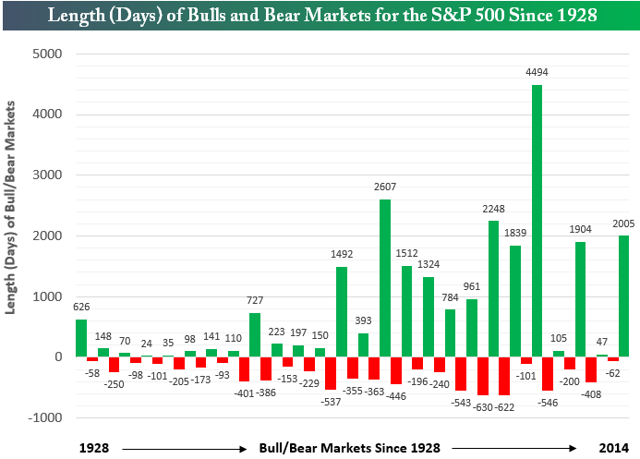
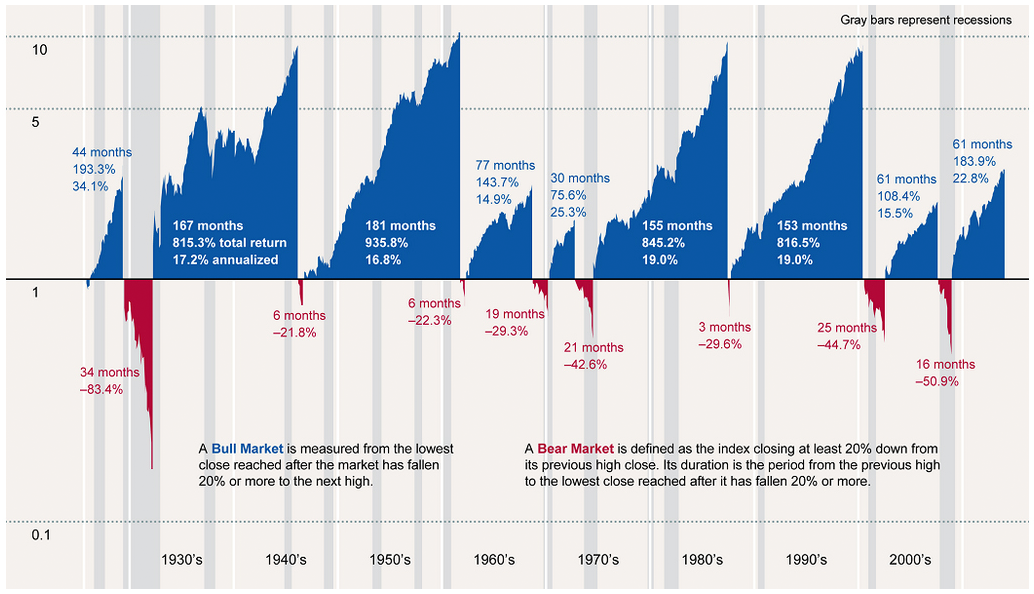
The equity market drops in the first three crises all recovered nicely and quickly. Will this time be the same? We believe it is quite likely though we still recommend caution.

  1. There is no crisis this time so far. The Chinese economy will definitely or has already slowed down from double digit to 7% or lower. But everyone tends to agree that it will grow at a reasonable pace. The Chinese stock market rout started after a dramatic run-up and a bubble-level valuation. The sell-off, though painful, was a necessary correction. As a word of caution, the bad news from China may not be over, we may  see more market volatility going forward.
  2. The US equity valuation is not cheap, but not at an extreme (see table above). During the crises in 1997 and 1998, the equities are much more expensive.
  3. The US monetary policy is ultra-loose. Even if the Fed may raise interest rates this year, the monetary policy is still very accommodative. The interest rates in 1997 and 1998 were much higher.
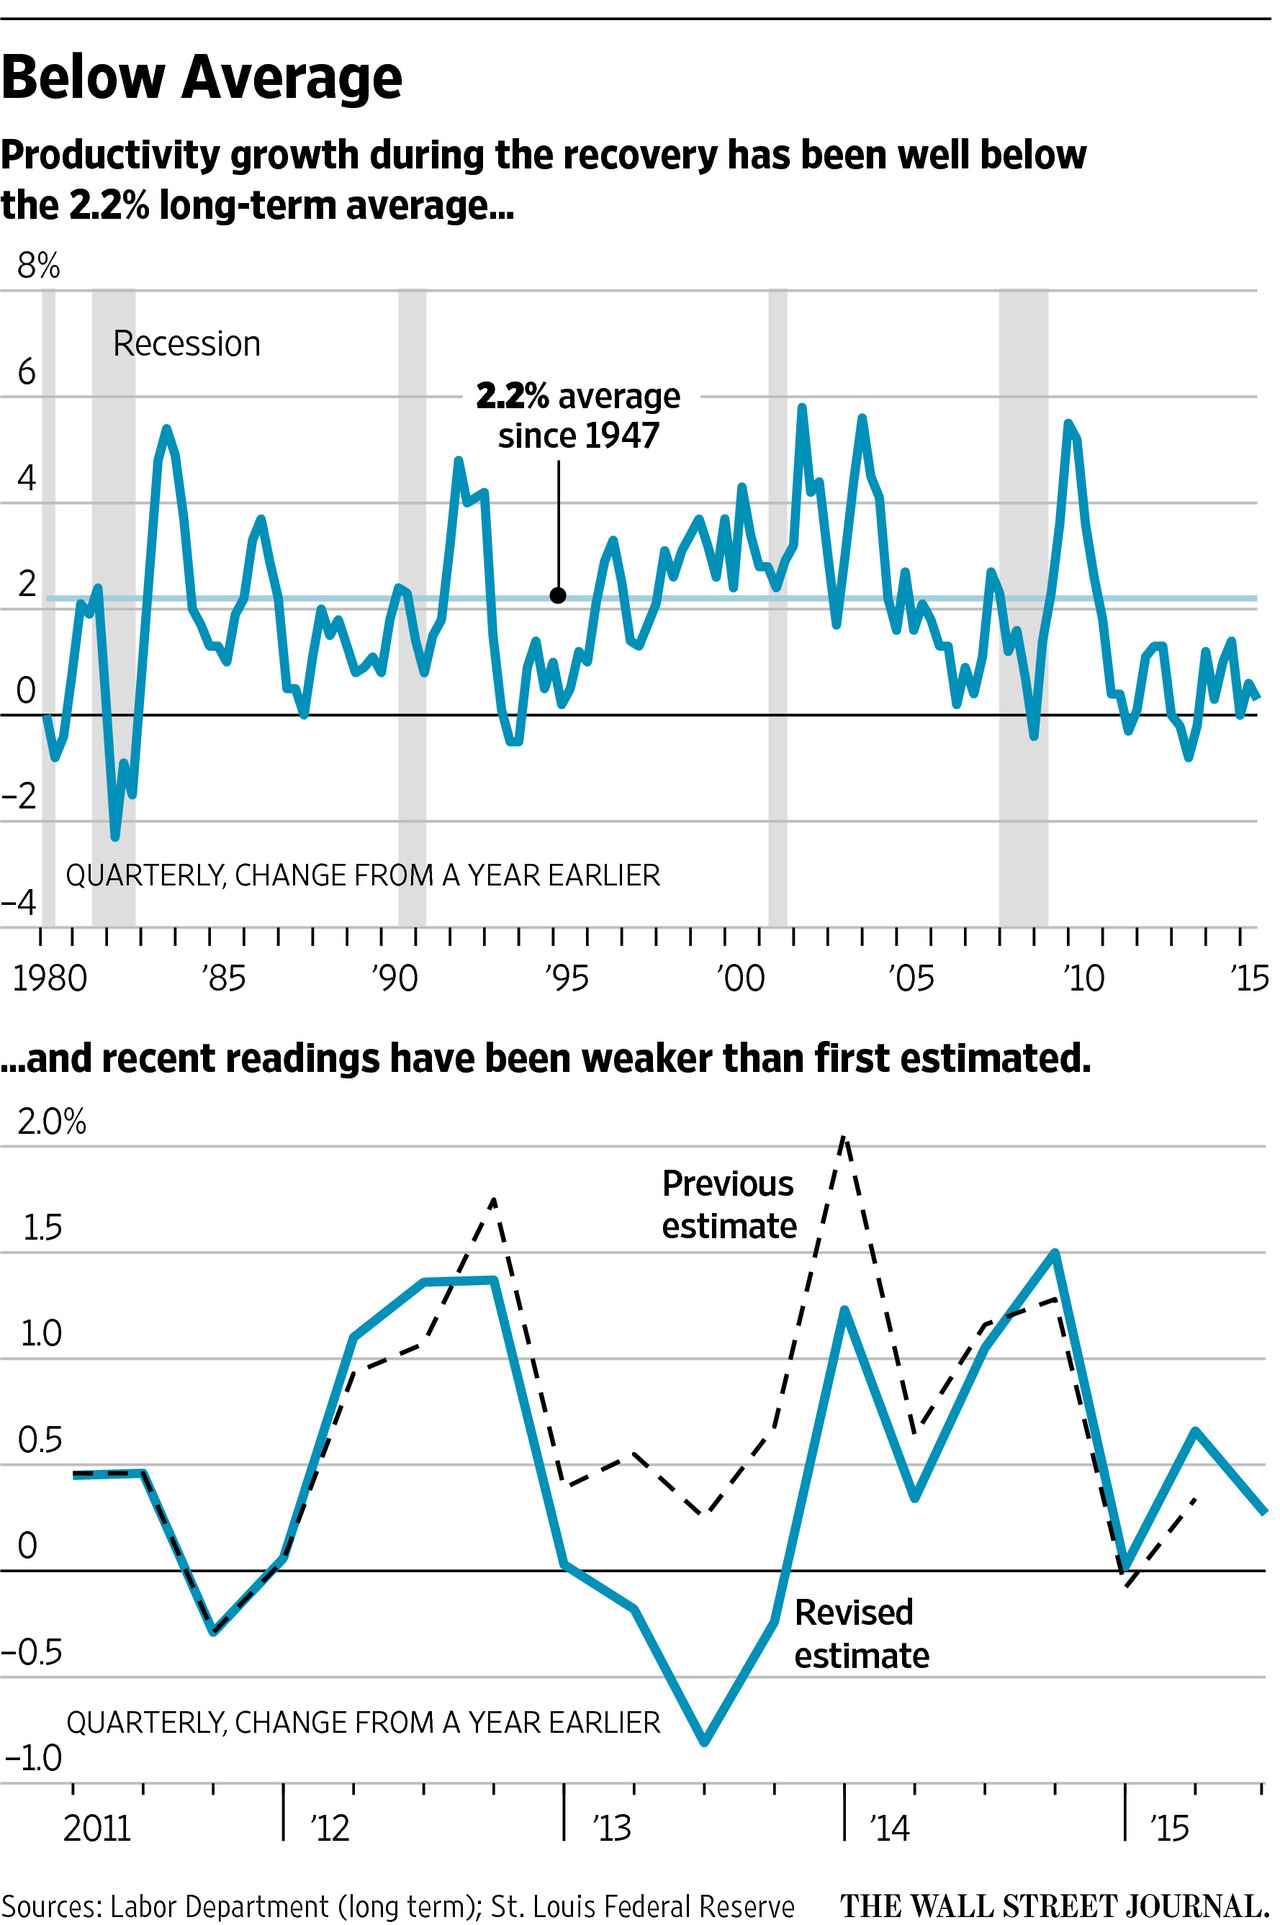
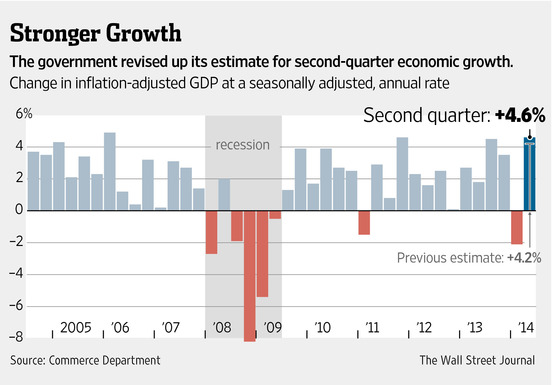
  4. The US economy is solid. In Q2, the US economy grew at 3.7% annual pace. ISM Manufacturing Index is still in expansion territory and unemployment rate is close to 5%. The slowdown in China will have limited impact on the US growth as the exports to China only account for 1% of the GDP in the US. However, the slowdown in China will have significant impacts on the US companies that are doing businesses there.

(Source: Julex Capital)

2nd Quarter 2015 Earnings Season Update

By Uncategorized

An Upbeat Start to Earnings Season

In the first quarter of 2015 reported earnings per share (EPS) were $21.51 for the S&P 500 Index, representing a decline of 14.23% from the prior year. The Materials and the Industrials sectors were the worst performers, with year-over-year EPS declining over 40%. Although Utilities and Financials were bright spots, gaining 40% and 20% year over year, respectively, many corporations provided overall lower guidance, and Wall Street analysts lowered second quarter earnings expectations.  Thomson Reuters’ data forecasted a 5.9% gain in earnings for Q2 in January for the S&P 500 Index, and by June these estimates were revised to a loss of 1.5%.

Corporate earnings releases kicked off unofficially on July 8th, when Alcoa (ticker: AA) reported solid second quarter profits. Through the market close on Tuesday, July 21st, 102 companies (roughly 20%) in the S&P 500 Index have reported earnings. Seventy percent beat earnings expectations, and 55% exceeded revenue forecasts. On the heels of a report that existing home sales were strong in June, reaching highs not seen since February 2007, it is no surprise that housing companies posted positive earnings. Specifically, Lennar Corp (ticker: LEN) reported $0.79 per diluted share, versus last year’s $0.61 per diluted share. Corporations that did not perform as well typically had revenue exposure overseas, and were hurt by a strong dollar, which reduces income derived outside of the US. Although the Technology sector posted year-over-year gains last quarter of 8.90%, tech companies surprised the market this week with lackluster earnings, with names like Qualcomm Corp (ticker: QCOM), Apple (ticker: AAPL), SanDisk Corp (ticker: SNDK), IBM and Microsoft (ticker: MSFT) missing expectations in one way or another. For example, Qualcomm reported a 47% decline in quarterly profits; Apple’s iPhone sales were lower than anticipated; SanDisk reported a drop in both revenue and profit; IBM’s operating EPS fell 13%; Microsoft earnings and revenue beat expectations, but had a loss for the quarter when previously disclosed restructuring charges were included.

Despite the soft spot in the Technology sector, the overall earnings season has started out well. In fact, we’re seen growth across Basic Materials, Consumer Goods, and Financials, with names like Bank of America (ticker: BAC) and Citigroup (ticker: C) beating expectations. Additionally, Walgreens Boots Alliance (ticker: WBA), Monsanto Co (ticker: MON), Constellation Brands (ticker: STZ), Darden Restaurants (ticker: DRI), and UnitedHealth Group (ticker: UNH) all posted EPS growth of 57%, 48%, 30%, 26%, and 15%, respectively. Should earnings continue to beat expectations, the US Equity market may extend its gains and even tolerate a future rate hike by the Fed.

EWM Monthly Commentary: Spring Seeds of Hope

By Uncategorized

After a long and difficult winter, many investors are wondering whether the Spring thaw will bring with it enough sustenance to reinvigorate the economy. First quarter data was less than upbeat, and despite a modestly positive start to April, several questions remain:

  1. Has oil reached a bottom?
  2. Does the US dollar have enough support to continue its upward trajectory?
  3. Has the Federal Reserve Bank (Fed) planted enough seeds for domestic growth?

Oil prices continue to weigh heavily on the stock market, as the price for a barrel of crude has precipitously fallen from a peak of $98 in September 2014 to $56 as of yesterday’s close. It dipped as low as $45 dollars a barrel in March but has rebounded back in recent weeks, supported by a strengthening in fundamentals and a tightening in supply.Global quantitative easing along with impending interest rates hikes have buoyed U.S. dollar strength.

The 10 year yield fell to 1.9% yesterday (4/16/15), hovering near all-time historical lows. Prior to 2011, the last time the 10 year yield was under 2% was February 23, 1951. Since that time, it has fluctuated regularly between 1.43% and 3.75%, falling below 2% on 357 of 1,073 trading days over the past four years.

As the Fed lays the groundwork for raising rates, it will have to consider when and at what pace. Although Janet Yellen did not rule out a June hike in the March meeting, the consensus handily favors September. Inflation is expected to remain low, and job growth slowed in March— driven in part by cuts in the energy sector which has historically been a key driver in non-farm job creation. Nonetheless, unemployment remains relatively stable at 5.5%, and the first quarter marked twelve consecutive months of job gains in excess of 200,000—the longest streak in nearly two decades.

So the big question is, does the recovery have legs, or will the engine stall? The signals are mixed. Following Wednesday’s disappointing industrial production numbers, estimates of real GDP growth fell to as low as 0.1% according to Atlanta Federal Reserve’s new GDPNow1 indicator; this comes in sharp contrast to GDP growth of 2.2% in Q414. Industrial production has been on the decline for the past three months, and March’s decline of 0.6% marked the largest decrease since 2012. A strong U.S. dollar is crippling exports, and weak oil prices have encumbered the operations of energy stalwarts.

On the positive side, consumer spending remains high, and housing starts are on the rise. Residential housing rebounded last month, although by less than expected.  The stock market is showing areas of opportunity, particularly in small- and mid-cap, with healthcare demonstrating solid gains.  It is worthwhile to note that at this juncture last year, Q1 2014 GDP also contracted, but the economy quickly recovered making positive strides for the rest of 2014. Although first quarter growth may similarly stall, the long term picture should remain robust, as we decelerate from an above trend environment to one of more moderate growth.

1 – The growth rate of real gross domestic product (GDP) is a key indicator of economic activity, but the official estimate is released with a delay. The GDPNow forecasting model provides a “nowcast” of the official estimate prior to its release.

Source:  https://www.frbatlanta.org/cqer/researchcq/gdpnow.cfm

EWM Monthly Commentary: July-2014

By Uncategorized

Domestic equity markets posted modest losses in July, after having delivered five straight monthly gains. Global turmoil finally caught up with stock prices, as Argentina failed to meet a deadline for a $539 million interest payment, and geopolitical unrest simmered in many parts of the world. On the positive side, economic data continued to trend well, highlighted this week by the first estimate of second quarter gross domestic product (GDP), which came in at +4.0% – a significant improvement over the -2.9% contraction of the first quarter. Employment gains remained robust in July, with 209,000 jobs added. Even though the gain was slightly below forecast, it represented the first time since 1997 that the economy has had six consecutive months of gains of more than 200,000. The unemployment rate ticked up to 6.2%. Geopolitical tensions continue to grab headlines and cause concern among investors.

Within this landscape, stocks were soft for the month. The S&P 500 declined -1.4% for the month, and is now up +5.7% on a year-to-date basis. The Dow Jones Industrials also dropped -1.4%. The tech-heavy Nasdaq Composite Index slid -0.8% as technology stocks continued to post solid relative results. The Russell 2000 Index of small cap stocks significantly under performed the Russell 1000 Index of large cap stocks, with returns of -6.1% and -1.6%, respectively. Growth stocks  fared slightly better than value stocks during the month. In terms of sector performance, telecom services was the strongest performer on a relative basis, gaining +3.7%, while utilities were the poorest performers, posting a decline of -6.8%.

International equity markets were also mostly lower in July, although performance was varied regionally. The MSCI World ex-U.S. Index dropped -1.0% for the month. Emerging markets continued their relative rebound, and outperformed developed markets for the month. The MSCI Emerging Markets Index gained +2.0% for the month. The MSCI EAFE Index, which measures developed markets performance, declined -2.0% for the month. Regionally, China and Pacific ex-Japan were the best performers on a relative basis, with the MSCI China Index and the MSCI Pacific ex-Japan Index gaining +7.3% and +3.7%, respectively. Eastern Europe and Europe were among the poorest performers, with results of -7.8% and -3.8%, respectively.

Fixed-income markets were mostly lower in July, but have still fared relatively well on a year-to-date basis. As has been its custom in every one of its meetings so far this year, the Fed continued its pace of tapering of its asset purchase program during the month, reducing purchases by an additional $10 billion. With this as a backdrop, the benchmark 10-year U.S. Treasury yield ended the month at 2.56%, up four basis points from the 2.52% level of June 30th. Broad-based fixed-income indices were modestly lower in July, with the Barclays U.S. Aggregate Bond Index shedding -0.3% for the month. Global fixed-income markets did not perform as well, with the Barclays Global Aggregate ex-U.S. Index returning -1.4% for the month. Intermediate-term corporate bonds were also lower, as the Barclays U.S. Corporate 5-10 Year Index dropping -0.2%. The Barclays U.S. Corporate High Yield Index posted a loss of -1.3% for the month. Municipals bucked the trend, and posted a gain of +0.2%.

Macro Overview-June 2014

By Uncategorized

Domestic equity markets posted moderate gains in June, advancing on the strength of many areas of the economy. Even though the final estimate of first quarter gross domestic product (GDP) came in at -2.9% – the largest contraction since 2008 – most segments of the economy have  trended higher in the second quarter. The first quarter GDP data was adversely impacted by the severe winter weather. Employment gains in June were a very robust 288,000, far exceeding consensus expectations. Payrolls now exceed the peak reached prior to the onset of the financial crisis in 2008. The unemployment rate also dipped to 6.1%. In addition, vehicle sales reached the highest annualized level in June since 2006, and the housing market continued to recover after stalling somewhat the prior two quarters as a result of higher mortgage rates. Several geopolitical skirmishes continue to cause some concern among investors.

Within this landscape, stocks posted generally positive results. The S&P 500 rose +2.1% for the month, and has now gained +7.1% on a year-to-date basis. The Dow Jones Industrials gained +0.8%. The tech-heavy Nasdaq Composite Index posted a solid return of +4.0% as technology stocks continued to recover from losses early in the year. In a reversal of the previous few months, the Russell 2000 Index of small cap stocks outperformed the Russell 1000 Index of large cap stocks, with returns of +5.3% and +2.3%, respectively. Value stocks  fared slightly better than growth stocks during the month. In terms of sector performance, energy was the strongest performer on a relative basis, gaining +5.1%, while telecommunications services were the poorest performers, posting a decline of -1.1%.

International equity markets were also mostly higher in June, although performance was not quite as strong as in domestic U.S. markets. The MSCI World ex-U.S. Index gained +1.7% for the month. Emerging markets continued to stage a sharp recovery from  the losses in January, and outperformed developed markets for the month. Investors have digested the impact of the Federal Reserve’s (“Fed”) reduction in asset purchases, and the European Central Bank’s recent move to lower the deposit rate to -0.1% (meaning banks have to pay to keep funds on deposit rather than make loans) has provided stimulus. The MSCI Emerging Markets Index gained +2.7% for the month. The MSCI EAFE Index, which measures developed markets performance, gained+1.0% for the month. Regionally, Japan and Latin America were the best performers on a relative basis, with the MSCI Japan Index and the MSCI EM Latin America Index gaining +5.2% and +4.2%, respectively. Europe and the Pacific region ex-Japan were among the poorest performers, with results of -0.07% and +0.1%, respectively.

Fixed-income markets delivered mixed performance in June, after having posted solid returns for the first five months of the year. As has been its custom in every one of its meetings so far this year, the Fed continued its pace of tapering of its asset purchase program during the month, reducing purchases by an additional $10 billion. The Fed’s meeting minutes indicate that the governors believe the purchases will now end by October. With this as a backdrop, the benchmark 10-year U.S. Treasury yield ended the month at 2.52%, up six basis points from the 2.46% level of May 31st. Broad-based fixed-income indices were little changed in June, with the Barclays U.S. Aggregate Bond Index advancing a mere +0.05% for the month. Global fixed-income markets performed somewhat better, with the Barclays Global Aggregate ex-U.S. Index returning +1.2% for the month. Intermediate-term corporate bonds were modestly higher, as the Barclays U.S. Corporate 5-10 Year Index advanced +0.1%. The Barclays U.S. Corporate High Yield Index posted a gain of +0.8% for the month. Municipals were moderately higher, gaining +0.1%.

Bull and Bear Market Durations

By Uncategorized

Bull & Bear Market Durations


The above graph shows the bull and bear market durations. The bull market that ended with the financial crisis lasted 61 months, according to Morningstar’s chart, but the two prior runs were 153 months and 155 months long. In other words, stocks were in an uptrend for more than 12 years.

The chart also shows that bear markets are relatively quick, with the last two lasting 16 months and 25 months, respectively.

(Source: Morningstar)