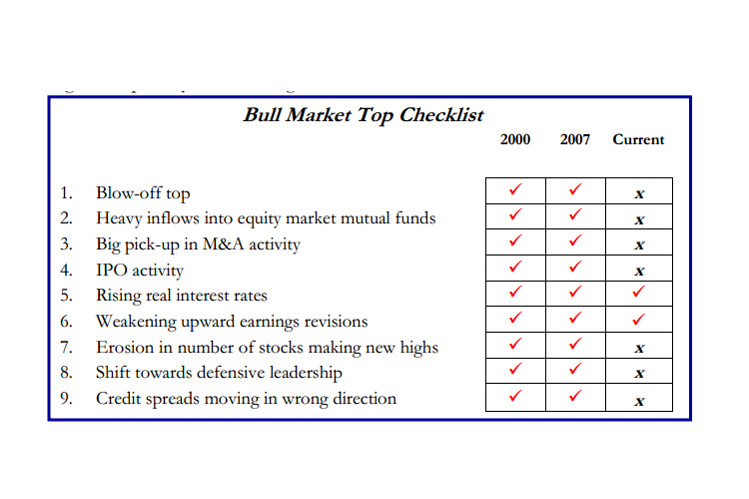
(Source: Strategas)
Investors who are worried about the market’s parabolic rise in the past five years and whether we are at or near a top, can use the above table to judget where we are in the cycle and whether the tide is about to turn the other way.
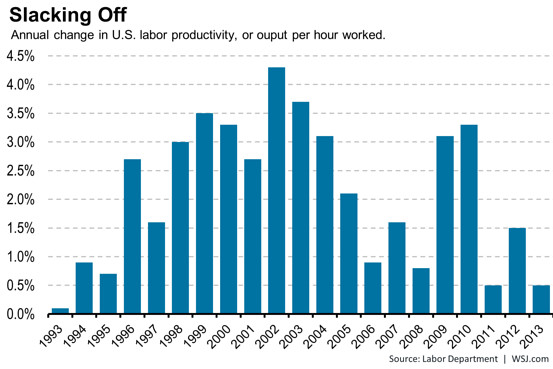
Businesses struggled to squeeze much more out of their workers last year.
A downward revision to fourth-quarter productivity lowered the gain for all of 2013 to just 0.5%, the Labor Department said Thursday. The small increase ties with 2011 for the weakest annual improvement since 1993.
Labor productivity, or output per hour, strengthened early in the economic recovery as businesses grew more efficient. The measure increased 3.1% in 2009 and 3.3% in 2010, to mark the best annual improvement since 2003. But gains have slowed considerably since, measuring 0.5% in 2011 and 1.5% in 2012.
The recent weakness was most pronounced in nondurable manufacturing, a sector that includes the processing of food, chemicals and petroleum, as well as textile and paper production. Sector productivity slipped 0.1% last year because output improvements were more than offset by increased hours worked.
The easing of productivity is a bit of a double-edged sword. The weak gains hold back the economy’s potential to grow. But it also could signal that businesses are finding it more difficult to meet demand with their existing workforce and equipment.
If companies can’t squeeze more out of current workers, they might need to ramp up hiring and capital investment.
(Source: Wall Street Journal)
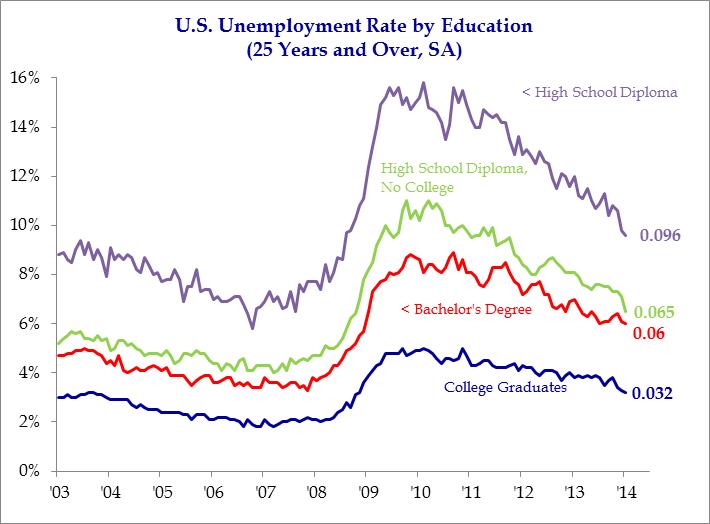
The U.S. unemployment rate fell to 6.6% in January, the lowest level since October 2008. The unemployment rate has been steadily falling since it peaked at 10% on October 2009. The rate of unemployment has been significantly different depending on the education level of the labor force participant. College graduates currently have an unemployment rate of 3.2%, while those with less than a high school diploma still struggle to find work.
(Sources: Strategas Research Partners, LLC, BLS)
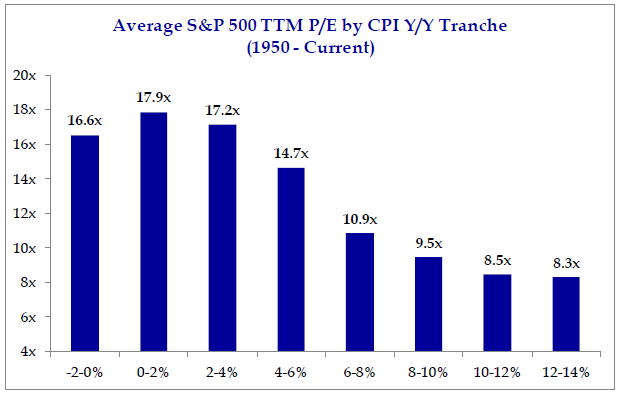
Equity valuations are still reasonable, especially when considering the inflation environment. Historically, inflation between 0%-2% (CPI is currently running at 1.2% year over year) has been a sweet spot for valuations. Even inflation readings up to 4% have been supportive for valuations. Concerns for multiples would arise if we see either deflation or inflation greater than 4%.
(Sources: Strategas Research Partners, LLC & Brinker Capital, Inc.)

The average dispersion between S&P 500® stocks over the twelve months of the year was just below 5%, which is the lowest value across the 23-year data.
In such circumstances, the relative value of active management in the equity markets is constrained. Simply put, accurate bets deliver less alpha.

The Fed has begun tapering asset purchases, starting with $10 billion in January, split evenly between U.S. Treasuries and mortgage-backed securities. If the Fed continues to taper by an additional $10 billion at each meeting, QE3 would end in October 2014, still providing liquidity throughout most of the year. The Fed is expected to keep short-term rates near zeor until at least 2015.
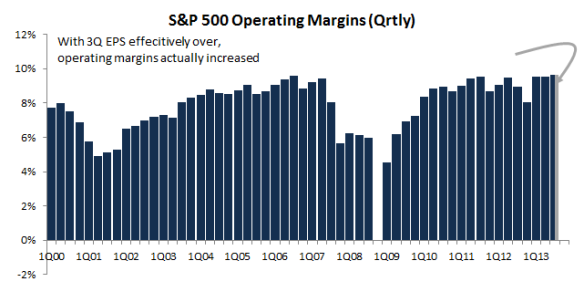
Do you think that the high Operating Margins will hold in 2014?
The major drivers for the high Operating Margins in 2013, viz. productivity, technology and cheap imports, should help again next year. Other factors like cheap energy and lower effective tax rates should continue to help as well. Plus, we do not see excesses in business investment, inventory or debt (personal or commercial) in 2014.
Persistently high profit margins should help equities in 2014.

The BalticDry Index is issued daily by the London-based Baltic Exchange and provides “an assessment of the price of moving the major raw materials by sea”, like, iron ore, coal, grain, cement, copper, sand and gravel, fertilizer and even plastic granules.
Since it targets real-time shipping rates, which fluctuate based on supply and demand, subjectivity can’t creep into the readings. Day in and day out, it provides a snapshot of global economic activity at the earliest possible stage.
Year-to-date, the index is up nearly 230%. It now rests at its highest level since late 2010.
Can this be a sign of global recovery improving in 2014?